Download
1 / 32
330 likes | 510 Vues
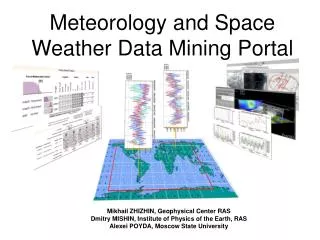
Meteorology and Space Weather Data Mining Portal. Dmitry MISHIN, Geophysical Center RAS Mikhail ZHIZHIN, Geophysical Center RAS Alexei POYDA, Moscow State University. Contents. Environmental data models Metadata ordering and mining extensions Supported data sources

E N D
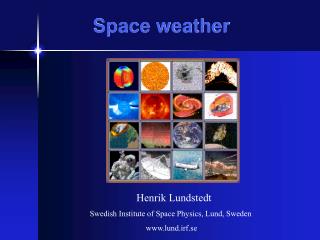
Meteorology and SpaceWeather Data Mining Portal • Dmitry MISHIN, Geophysical Center RAS • Mikhail ZHIZHIN, Geophysical Center RAS • Alexei POYDA, Moscow State University
Contents • Environmental data models • Metadata ordering and mining extensions • Supported data sources • Data mining extensions for OGSA-DAI • Environmental scenario defined by fuzzy logic • Data mining web portal workflow use case • Possible applications
Environmental data models Main environmental data structure is time series, i.e. an array of values of a parameter at different times on regular grid or specified locations (station data). Sequence of pairs, each having time and location is a trajectory.
ES metadata ordering extensions • Our metadata repository can handle different schemas in separate sections, f.e.: • FGDC • collection level, most suitable for digital maps, widely adopted by ES community • SPASE (NASA) • collection and inventory level, used by the Space Weather community • ECHO (NASA) • collection and inventory level, used by the Remote Sensing community • ESSE (NOAA and MSR) • collection and inventory level, used by the ESSE data mining project to describe virtual environmental data source in Grid • Metadata ordering extensions are used to build a data request and fuzzy search for environmental scenario.
Environmental data sources integration Space weather World Data Centers: • SPIDR (Space Physics Interactive Data Archive) • From 1930 year • ~120 numerical parameters • ~0.5 TB NOAA and ECMWF • NCEP/NCAR Weather Reanalysis Project • From 1950 year • Weather parameters on regular grid, 2.5 deg step • ~1 TB • ERA40 Weather Reanalysis Project • From 1957 year • Weather p7arameters on regular grid, 1 deg step • ~2 TB • NWS Weather forecast • Weather parameters on regular grid, 1 deg step NOAA CLASS (Comprehensive Large Array-data Stewardship System) • Satellite images • From 1992 year • Satellite images from ~100 spectral channels • ~1.2 PB, growing ~0.5 PB per year • Time series data products OpenDAP servers network … Climatology models Remote sensing
GRID data services: http://www.ogsadai.org.uk/ • Pros for scientific applications: • Can be run both in GRID (WSRF, OMII) and pure • web services container (Tomcat Axis) • Data requests using XML allows data processing in • heterogeneous environments • Can be extended to access different types of data sources using activities and data resources
Data flow management by OGSA-DAI OGSA-DAI query from single data source OGSA-DAI query from distributed data sources
Activities for data export • XML output stream • We have plugin for NASA World Wind to visualize XML-formatted data • Can easily be transformed using XSLT to web page or another XML document, e.g. MS Excel • Can be used as input for ESSE fuzzy logic search engine • NetCDF binary data file • Standard for scientific data storage in files • There are several visualization programs for NetCDF • Compatible with Unidata Common Data Model standard
How to interpret a question of a scientist? • Introduce the notion of an Environmental Scenario (ES) as a basic building block for scientific question • Interpret ES as a fuzzy query expression • Each basic condition in a ES translates into membership function of a fuzzy set, a term in a resulting expression • An expression is built using traditional fuzzy logic operations plus “time shift” operator • Query terms are evaluated at individual data sources • The ESSE engine collects the data and performs fuzzy query operation. The ESSE engine is built as a Web Service. This enables cascading queries, but raises new research challenges, e.g. optimization of query execution.
Environmental scenario State S1 corresponding to the red (upper-right) region is the fuzzy expression: S1 = (VeryLarge P) and(VeryLarge T) State S2 corresponding to the cyan (lower-left) region is: S2 = (VerySmall P) and(VerySmall T) Combining the descriptions of the states with the time shift operator shiftdt, we can write the following symbolic expression for the Environmental Ccenario “very low temperature and pressure after very high temperature and pressure”: (shiftdt=1 S1) and S2 Time series as a trajectory in the two-dimensional phase space (P-pressure, T-temperature)
Classical and fuzzy sets Indicator function IA(u) for the classicalset A = {x|5 x 8} Fuzzy membership function μA(u) for theset A = [5, 8]
Fuzzy logic operations Intersection Fuzzy T-norm Union Fuzzy T-conorm Logical not Fuzzy complement
How to synthesize and present results of a distributed query? • Environmental Scenario search result is a scored list of candidate events. “Score” represents the “likeliness” of each event in a numerical form • The result page provides links to visualization and data export pages • Each event can be viewed as • time series • dynamic 5D volume • WorldWind color map on Earth surface • satellite images animation • Data subset for each event can be exported in XML and NetCDF formats
Web portal use case • In the following example we will search for a E-W • atmospheric front near Moscowdescribed by three • parameters “air pressure”, “E-W wind speed” Uwind) • and “N-Swind speed” (Vwind) with subsequent • fuzzystates: • (Small pressure) and(LargeV-wind-speed) • (Large pressure) and(SmallU-wind speed) • and(SmallV-wind-speed).
Step 1. Select data source The user logs in to the IDEAS portal and receives a list of the currently available (distributed) data sources. For each data source the list has abridged metadata like name, short description, spatial and temporal coverage, parameters list and link to full metadata description. The user selects environmental data sourcebased on the short description or by metadatakeyword search (e.g. NCEP/NCAR Reanalysis).
Step 2. Select spatial location The portal stores the data source selection on the server side in the persistent “data basket” and presents a GIS map with the spatial coverage of the data source. The user selects a set of “probes” (representing spatial locations of interest, e.g. Moscow) for the searching event.
Step 3. Select environmental parameters IDEAS stores the selected set of ”probes” and presents a list of all the environmental parameters available from the selected data source and a fuzzy constraints editor on the parameters values which represent the event. The user selects some of the environmental parameters and sets the fuzzy constraints on them for the searching event (e.g. low pressure, high V-wind speed).
Step 4. Edit environmental scenario Multiple subsequent environment states can be grouped to form the actual environmental scenario. For example, we need to define the two different states mentioned above. Adding and removing fuzzy states is done via a Web- form. ESSE stores the searching environment states and sends them to the fuzzy search web-service in the XML format.
Step 5. Search for events The fuzzy search web-service collects data from the data source for the selected parameters and time interval, performs the data mining, and returns to the IDEAS web application a ranked list of candidate events with links to the event visualization and data export pages.
Step 6. Visualize event The user visualizes interesting events and requeststhe event-related subset of the data fordownload from the data source in the preferredscientific format (XML, NetCDF, CSVtable).Currently there are four visualizationtypes available: time series, animatedvolume rendering using Vis5D, DMSP satellite images and NASA WorldWind visualization.
CLASS: Comprehensive Large Array-data Stewardship System. Portal prototype. • Supported data: • Time series: • NCEP/NCAR weather reanalysis (ESSE) • Geomagnetic indices database – SPIDR • Ionospheric data – SPIDR • Sea surface temperature – NGDC NOAA • Satellite images • DMSP • MODIS • CLASS (AVHRR)
Fuzzy search for CLASS CLASS portal can filter satellite orbits database search for given location based on the fuzzy event definition such as Low Cloud Coverage (cloud free orbits) or magnetic storm (Aurora images).
Fuzzy data mining is used by: ESSE http://esse.wdcb.ru/ Environmental Scenario Search Engine The main idea behind ESSE is a flexible, efficient and easy to use search engine for data mining in environmental data archives. The project is supported by Microsoft Research, Cambridge, and NOAA CLASS http://spidrd.ngdc.noaa.gov/class/ Comprehensive Large Array-data Stewardship System CLASS is NOAA's premier on-line facility for the distribution of NOAA and US Department of Defense (DoD) Polar-orbiting Operational Environmental Satellite (POES) data and derived data products DEGREE http://degree.ipgp.jussieu.fr/ Dissemination and Exploitation of GRids in Earth science The project aims to promote the GRID culture within the different areas of ES and to widen the use of GRID infrastructure as platform for e-collaboration in the science and industrial sectors and for select thematic areas which may immediately benefit from it
Thank you http://esse.wdcb.ru http://spidrd.ngdc.noaa.gov/class esse@wdcb.ru