Download

1 / 26

E N D
Exam I John H. Vande Vate Spring, 2006 1
Question 1 • … centers to minimize its total transportation costs from its 2 plants to its 5 markets. We are only concerned with transportation costs. Our contracts with the transportation provider ensure that we pay a fixed amount for each unit of product we move on any lane (i.e., directly between to locations). The two plants make similar, but different and non-substitutable products. We have contracts to deliver each of the products to each of our customers in specified quantities. 2
Excel Version Plant 2 ships nothing to DC 3 Yet DC 3 ships Plant 3 product to market 3
AMPL Version set PLANTS; set DCs; set MARKETS; set EDGES within (PLANTS union DCs) cross (DCs union MARKETS); param Cost{EDGES}; /* Unit transport cost on each edge (from, to) */ param Demand{MARKETS, PLANTS}; /* Demand in each Market for product from each plant */ 4
AMPL Version var Flow{EDGES, PLANTS} >= 0; /* Volume of flow of product from each plant moving on each edge (from, to) */ minimize TransportCost: sum{(from, to) in EDGES, plant in PLANTS} Cost[from, to]*Flow[from, to, plant]; s.t. FlowConservation {dc in DCs}: sum{(from, dc) in EDGES, plant in PLANTS} Flow[from, dc, plant] – sum{(dc, to) in EDGES, plant in PLANTS} Flow[dc, to, plant] = 0; s.t. FlowConservationBYPLANT {dc in DCs, plant in PLANTS}: sum{(from, dc) in EDGES,plant in PLANTS} Flow[from, dc, plant] – sum{(dc, to) in EDGES, plant in PLANTS} Flow[dc, to, plant] = 0; 5
AMPL Version s.t. MeetDemand{market in MARKETS}: sum{(from, market) in EDGES, plant in PLANTS} Flow[from, market, plant] = Demand[market, plant]; Should be: s.t. MeetDemandBYPLANT{market in MARKETS, plant in PLANTS}: sum{(from, market) in EDGES, plant in PLANTS} Flow[from, market, plant] = Demand[market, plant]; 6
Question 2 We ship 100,000 units each year each worth $1,000. We calculate the inventory holding cost at 30% per year. Ocean shipments are available once per week, require 17 days and cost $3 per unit. Air shipments are available every weekday or about 250 days per year, require 3 days and cost $20 per unit. Which mode would you recommend based solely on this figures. Explain your answer. 7
Question 2 • What costs to consider? • Transportation cost: $3 vs $20 per unit • Pipeline Inventory cost: 17 days vs 3 days • Cycle Stock inventory: 7 days vs ~daily • Transportation costs: • Ocean: $3/unit * 100,000 units/year = $300,000/year • Air: $20/unit * 100,000 units/year = $2,000,000/year 8
Question 2 • Cycle Stock • Either half a shipment (if we just consider US or an entire shipment if we consider Asia and US) in inventory at facilities on average. • Why don’t we use EOQ to calculate optimal frequency? 9
Question 2 • Ocean Shipment Size? • 100,000 units/year / 52 shipments/year 100,000/50 = 2,000 units/shipment • Air Shipment Size? • 100,000 units/year / 250 shipping days/year = 400 units/shipment • Cycle Stock • Ocean: $1,000/unit * 2,000 units in inventory = $2 million capital in inventory or $600,000 in annual carrying cost for cycle stock • Air: $1,000/unit * 400 units in inventory = $400,000 capital in inventory or $120,000 in annual carrying cost for cycle stock 10
Question 2 • PIPELINE INVENTORY • Question: What influences pipeline inventory? • Annual volume of shipments? • Value of product? • Shipment frequency? • Transit time? 11
Why Shipment Size Does NOT Matter • One shipment of 100,000 units • 365 days • For 17 days 100,000 unit in pipeline • For 348 days 0 units in pipeline • 46,575 units in pipeline on average 12
Ship Every Day • One shipment per day • 274 units per day (273.97= 100,000/365) • Always 17 days of shipments in the pipe • 274*17 46,575 • Another way to see this • Avg Items in the Pipe = Total Item Days in the Pipe per year/Days per year Shipment size doesn’t change either of these. 13
Pipeline Inventory • Daily Production 274 units per day (273.97= 100,000/365) $274,000 of capital to fund one day of transit inventory • Ocean 17 days * 274 units/day * $1,000/unit = $4,658,000 capital in the pipe = $1,397,400 carrying cost per year • Air 3 days * 274 units/day * $1,000/unit = $822,000 capital in the pipe = $246,600 carrying cost per year 14
BL Ocean Air • Transit $300,000 $2,000,000 • Cycle $600,000 $120,000 • Pipeline $1,397,400 $246,600 • Total $2,297,400 $2,366,600 15
Question 3 • One of the motivations Greg Andrews from Adtran gave for establishing a legal entity in Hong Kong was to improve “visibility and control of RMS material from suppliers to Contract Manufacturers”. Explain what he was talking about. 16
Question 3 • 3-4 items • Ping-ponging • Discrepancies • Receipts • Masking 17
Question 4 • We distribute stuffed toys to retail stores across the country. Our trailers hold 3,900 cubic feet and a case of stuffed toys takes 4 cubic feet. We would like to replenish the stores every 8 days, but recognize that to do that we lose one day to activities like transmitting and picking the order and one day to local delivery from the pool point. This leaves on 6 days for loading and transportation. We have one DC in Memphis, Tennessee. 18
Question 4 • Part A. How many cases per year must the stores served by our Seattle Pool Point sell if we are going to make our 8-day replenishment target? Note driving time from Memphis to Seattle is approximately 4 days. Assume we operate 250 days per year. Justify your answer. • How many days do we have to fill the trailer? 19
Demand At the Pool • To fill the trailer we need • 975 cases = 3900 cubic feet/4 cubic ft per case • To fill the trailer in 2 days we must order • 488 cases per day total at the stores served by the pool (975/2) • That means these stores must have a combined annual demand of 488*250 = 121,875 cases per year 20
Part B: Formula param DaysBackToSales; /* 8 days */ param TrailerCube; /* e.g., 3900 cubic feet */ param CaseCube; /* e.g., 4 cubic feet */ param LostDays; /* e.g., 2 days */ param StoreVolume{STORES}; param TransitDays{POOLS}; /* Days travel */ param MinVolume{POOLS}; for {pool in POOLS} {let MinVolume[pool] := (TrailerCube/CaseCube)*250/ (DaysBackToSales- LostDays- TransitDays[pool]) }; 21
Part B: Formulation var Open{POOLS} binary; var Assign{STORES, POOLS} binary; minimize TotalCost: … s.t. AssignEachStore{store in STORES}: sum{pool in POOLS} Assign[store, pool] = 1; /* Ensure each pool meets the service target */ s.t. PoolsPullFastEnough{pool in POOLS}: sum{pool in POOLS} StoreVolume[store]*Assign[store, pool] >= MinVolume[pool]; Should be store in STORES *Open[pool] 22
Missing Constraints • s.t. OnlyAssignToOpenPools{store in STORES, pool in POOLS}: Assign[store, pool] <= Open[pool]; 23
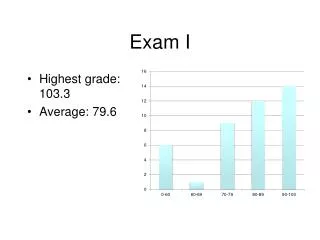
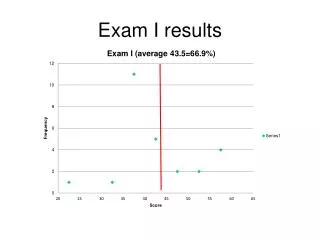
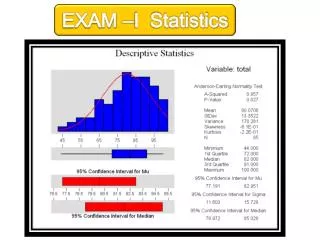
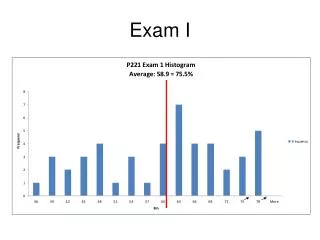
Performance Average: 61 24
Expectation Expected Average to be between 63 and 82 Question 1: 20 – 25 Question 2: 20 – 25 Question 3: 15 – 20 Question 4: 8 – 12 25