Download
1 / 24
240 likes | 368 Vues
Polarization in Pulsar Wind Nebulae. Delia Volpi In collaboration with : L. Del Zanna - E. Amato - N. Bucciantini Dipartimento di Astronomia e Scienza dello Spazio-Università degli Studi di Firenze-Italy. Observations : optical and X-ray. Continnum emission Jet-torus structure

E N D
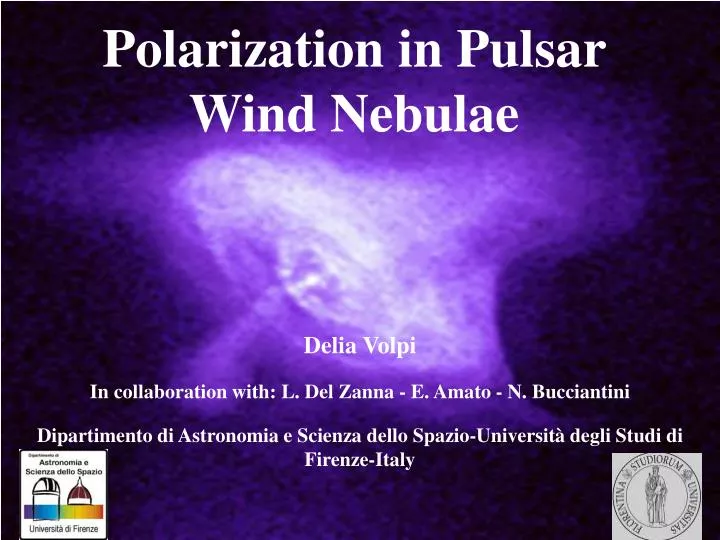
Polarization in Pulsar Wind Nebulae Delia Volpi In collaborationwith: L. Del Zanna - E. Amato - N. Bucciantini Dipartimento di Astronomia e Scienza dello Spazio-Università degli Studi di Firenze-Italy
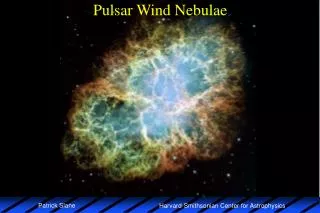
Observations: optical and X-ray Continnumemission Jet-torusstructure Crab Nebula PWN Optical (Hubble) X-ray (CHANDRA) Vela PSR 1509-58 G 54.1+0.3
RELATIVISTIC MHD Models • Analytical 1-D models (Kennel & Coroniti ,1984 --Emmering and Chevalier,1987): no jet-torusstructure. • Analytical 2-D models (Bogovalov & Khangoulian, 2002 --Lyubarsky, 2002): anisotropicPoynting+kineticenergyfluxtorus and oblate TS. Jetscollimatedbyhoopstressesdownwards TS. • RMHD simulations (Komissarov and Lyubarsky, 2003 – Del Zanna et al., 2004) solve 2-D hyperbolicequations and confirmjet-torusmorphologytheories Lyubarsky, 2001
IDEAL RMHD EQUATIONS ECHO: GRMHD 3-D VERSION (Del Zanna et al., 2007, A&A, 473, 11)
Numericalmodel • 2-D (axysimmetric) RMHD shock capturing code in sphericalcoordinates(Del Zanna et al., 2002, 2003, 2004) • InitialcoldultrarelativisticPulsar Wind withvradial and r-2 +SNR+ISM Lorentzfactor (conservationofenergyalongstreamlines) : Anisotropicenergyflux: Toroidalfield: • Space and timeevolutionof RMHD equations+maximumparticleenergy (Lorentzfactor) equationwithadiabatic and synchrotronlossesaveraged on the pitch angle: (b =/2) w=c2+4p
Synchrotronemissionrecipes • Emittingparticles’ isotropicdistributionfunction at termination shock (TS = 0) (Kennel & Coroniti, 1984b): • Post-shock distribution function (obtained from conservation of particles’number along streamlines and under condition of 0.5): spectralindex
Synchrotronemissionrecipes • Emissioncoefficient in observer’sfixed frame: Relativisticcorrections: • Cut-offfrequencyforsynchrotronburn-off (evolved in the code from the maximumparticleenergy): optical or X-rayfrequencyofobservation observer direction versor
Synchrotronemissionrecipes • Surfacebrightness: • Stokesparameters (linearpolarization): • Polarization fraction () and polarization direction (P): • Spectral index () for two frequencies (1, 2) and integrated spectra (F): localpolarization position angle betweenemittedelectricfield and Z d=distanceofemittingobject
Wind magnetization • Runs with effective=0.02 (averaged over ) • A (=0.025, b=10) B (=0.1, b=1)
Results: flow structuremaps =0.025, b=10 narrow striped wind region =0.1, b=1 large striped wind region • RunA: a) Stronger pinching forces smaller wind zone; b) Equipartition near TS; c) Larger magnetized region • particles loose most of their energy nearer to TS; d) Less complex magnetization map. • Supersonic jets and equatorial outflow: v 0.5-0.7c (as in Crab Nebula-Hester-2002, Vela-Pavlov 2003).
Results: surfacebrightnessmaps =0.025, b=10 narrow striped wind region • Optical and Xemittingparticles: • = 0.6 (Veron-Cetty & Woltjer,1993) • Cut-offfrequencies: • =5364 Å in optical maps (V.C.1993) • h=1keV in X maps (Chandra) • Angles (Weisskopf, 2000): • inclinationofsymmetryaxis:300 • rotation respectto North: 480 • I normalized respect to maximum • value, logarithmicscales • Largeremittingregions in optical • thanin X bandsynchrotron burn-off • Internalregions: system ofrings • (connectedtoexternalvortices), • brighterarch (inner ring), a centralknot • (connectedtopolarcuspregion) due to • Doppler boosting (very strong near • TS, vc) • Strongeremissionnear TS where • magnetization and velocity are higher =0.1, b=1 large striped wind region
HIGH RESOLUTION POLARIZATION MAPS TOY MODEL UNIFORM EMITTING TORUS WITH B TOROIDAL AND V RADIAL : ANGLE SWING INCREASES WITH V AND BIGGER IN THE FRONT v=0.2C θ=90° - - v=0.5c θ=75° -- v=0.8c θ=60°=>INFORMATION ABOUT FLOW VELOCITY POLARIZATION FRACTION=>MAXIMUM EVERYWHERE SAME EFFECT WITH A KC FLOW
Results: opticalpolarizationmaps =0.025, b=10 narrow striped wind region • Synchrotron emission linear • polarization • Polarizationfraction: Bpoloidal • Normalizationagainst • (+1)/(+5/3)70% • Alongpolaraxis: • higherpolarized fraction • (projected B line of sight) • Outerregions: depolarization • (oppositesignsofprojected • Balonglineofsight) • Polarization direction: vflow • Ticks: ortogonaltoB, lenght • proportional to Π (Schmidt, 1979) • Polarization angle swing • (deviationofvector direction) • in brighter arcs, v c, • strong Doppler boost • Biggereffect in the front side • Originof the knot????? • RunB: more complexstructure • slow velocity =0.1, b=1 large striped wind region
Results: X-raypolarizationmaps =0.025, b=10 narrow striped wind region =0.1, b=1 large striped wind region
Results: spectralindexmaps =0.025, b=10 narrow striped wind region = + 1 • ValuesofCrab Nebula • Opticalmapsobtainedwith: • 1=5364Å, 2=9241Å • (Veron-Cetty & Woltjer, 1993) • X-raymapsobtainedwith: • h1=0.5keV, h2=8keV • (Mori et al., 2004) • Spectralindexgrowsfrom • innertoouterregions • RunA: X-raysimulatedspectral • indexmapssimilartoonesof • Crab Nebula (Mori et al, 2004) =0.1, b=1 large striped wind region
Observations: gamma-ray • MAGIC Telescope (J.Albertet al., Arxiv:0705.3244v1, 2007) • Crab Nebula: gamma-ray standard candle → target of new instruments • Emission: acceleratedelectrons+targetphotons (CMB+FIR+sync) • HESS: TeVfrequencies; GLAST: 20MeV-300GeV • Disantanglemagneticfield and distributionfunction+adroniccomponent
Synchrotron and IC emissionrecipes • Primordialisotropicradio-emittingpopulation (A&A,1996): • Acceleratedwindpopulation at TS (A&A,1996): • Evolveddistributionfunction (Del Zanna et al., 2006): • Integration between spectral power per unit of frequency and distributionfunction: synchrotron=> monochromaticfrequency IC => respect to ε and ν, total differential cross section, 3 targets (FIR, CMB, SYNC) (Blumenthal and Gould, 1970)
Results: IC =0.025, b=10 narrow striped wind region Multislopes Disconnetted areas in maximum particle energy IC emission in excess Energy map: Compressionaround TS ofB. Parameter?Distributionfunction?
Results: IC =0.025, b=10 narrow striped wind region Sizereductionwithincreasingfrequency: alongy-axis Jet and torusvisiblefor radio electron distribution, no observationalcounterpart
Results: IC =0.025, b=10 narrow striped wind region Time-variability: gamma-rayssimilartoX-rays.
Conclusions • Spectra: wellreproducedfrom radio toX-ray. Excess in gamma-ray due tocompressionofBaround TS (fluxvortices). • Brightnessmaps: jet-torusstructure in gamma-raysas in X-rays (high resolution). Observeddimensions. • Gamma-ray (asX-ray) time-variabilityiswellreproducedby MHD motions. COMPLETE SET OF DIAGNOSTIC TOOLS FOR PWNe AND OTHER EMITTING SOURCES (AGN, GRB) • Future work: directevolutionof the distributionfunction; investigationof the parameterspace; applicationstootherPWNe (differentevolutionstages) and othernon-thermalemittingsources (AGN, GRB). • Paper: Simulatedsynchrotronemissionfrom Pulsar Wind Nebulae (L.Del Zanna, D.Volpi, E.Amato, N.Bucciantini, A&A, 453, 621-633, 2006) • Paper: Non-thermalemissionfromrelativistic MHD simulationsof pulsar windnebulae: fromsynchrotronto inverse Compton, D.Volpi, L. Del Zanna, E. Amato, N. Bucciantini, A&A, 2008, 485, 337
WHICH KIND OF CONTINUUM EMISSION FROM RADIO TO SOFT-GAMMA ? CRAB NEBULA: SAME FRACTION AND POSITION ANGLE OF POLARIZATION FROM RADIO TO X-RAYS=> SIGNATURE OF SYNCHROTRON EMISSION OPTICAL (SHKLOVSKY, 1952- DOMBROVSKY, 1954) SYNCHROTRON EMISSION=> LINEAR POLARIZATION WITH A MAXIMUM OF ≈ 80% IMPORTANCE OF POLARIZATION: GEOMETRY OF THE SOURCE (PULSAR WIND) PROPERTIES OF THE SOURCE=>MAGNETIC FIELD STRENGHT AND DIRECTION 3) ACCELERATION OF PARTICLES OBTAIN SYNTHETIC MAPS FROM NUMERICAL SIMULATIONS AND COMPARE WITH OBSERVATIONS: STUDY OF POLARIZATION
IC emissionrecipes • Integration between distribution function (primordial and wind) and power per unit of frequency respect to ε and ν(Blumenthal&Gould, 1970) • Incidentphoton density per unitoffrequency: IC from CMB target IC from FIR target IC from SYN target