Download
1 / 40
400 likes | 528 Vues
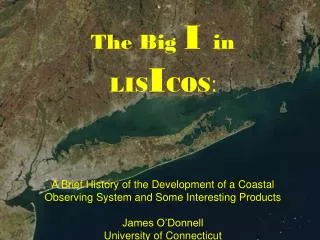
Model Support for Developing and Implementing a Nitrogen TMDL for Long Island Sound. Mark A. Tedesco EPA LIS Office. Long Island Sound Study. National Estuary Program CWA 320 CWA 119 Sponsored by EPA, NYSDEC, CTDEP Begin in 1986. The Watershed. 16,000 sq. mile watershed

E N D
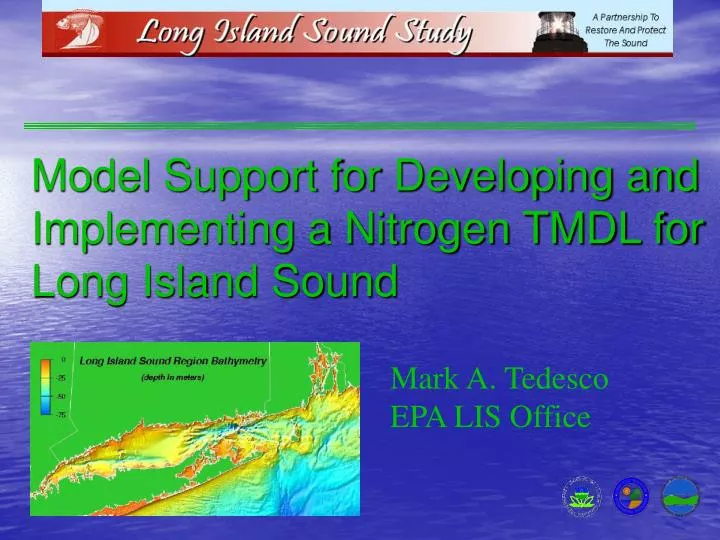
Model Support for Developing and Implementing a Nitrogen TMDL for Long Island Sound Mark A. Tedesco EPA LIS Office
Long Island Sound Study • National Estuary Program • CWA 320 • CWA 119 • Sponsored by EPA, NYSDEC, CTDEP • Begin in 1986
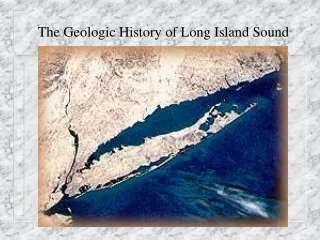
The Watershed • 16,000 sq. mile watershed • 1,300 sq. mile water surface • two connections to the ocean • East River in the west • The Race in the east • 8 Million People
TMDL Requirements • Identify “Water Quality Limited” Waters • Specify Allowable Pollutant Loading • Point Sources • Nonpoint Sources • Margin of Safety • Public Participation
How it Started • 1986: LIS TAC recommends modeling approach to support hypoxia management • Report of the LIS Modeling Workshop, 27-28 January 1986, MRSC Ref. 86-6, Working Paper 26 • 1987: Preliminary modeling and data collection • 1988-89: Intensive data collection, model development for 3-d model (LIS 3.0) • Independent Model Evaluation Group (MEG) established for review
Key Issues • Attainment of water quality standards • Technical basis for DO standard • High cost burden for POTW upgrades • Perceived equity between point and nonpoint sources • NYC vs. CT River • Uncertainty in managing out-of-basin loads
LIS Eutrophication Model (LIS 3.0) HYDRODYNAMIC MODEL (NOAA/NOS) Inputs: Winds, tides, solar radiation, freshwater flows, boundary S&T Outputs: Circulation, volumes, density stratification EUTROPHICATION MODEL (HydroQual, Inc.) Inputs: Pollutant loads Outputs: Water quality as function of time and space SEDIMENT SUBMODEL (HydroQual, Inc.) Inputs: Deposition of particulate organic matter Outputs: Fluxes of sediment oxygen demand and nutrient
Management Framework • Proceed in phases • Identify conditions that will minimize adverse impacts • Make cost-effective progress from in-basin sources • Equitably allocate reductions • Incorporate in TMDL • Consider out-of-basin sources and actions • Atmospheric deposition • import for outside states
Proceed in Phases • Phase I: nitrogen freeze at 1990 levels (1990) • Phase II: low-cost nitrogen reduction (1994) • Phase III: Reduction targets to achieve water quality objectives
DO Benchmarks for Hypoxia Management • Surface waters • > 5.0 mg/l (one-day average) • Bottom waters • fully protective: • > 5.0 mg/l (one-day average) • protective for most species: • > 3.5 mg/l (one-day average) • 2.0 mg/l minimum
Unit Response Matrix • LIS 3.0 run to calculate DO response from different Management Zones • What-if scenarios • Cost curves • Estimated incremental nitrogen reductions and costs from different levels of management • Calculated incremental DO improvement from actions taken in different areas • Plot incremental nitrogen reductions and incremental DO improvement versus incremental cost
Nitrogen Management Zones NY - CT Domain
LIS 3.0 Nitrogen Loading Scenarios • Base Case • Phase 2 Reductions • Cost-Sensitive Reductions • Limit of Technology • DO Targets (Protective of Species) • Pastoral
Characterize Ecological Effects of Scenarios • Describe biological impacts in 0.5 mg/l intervals from 0-5 mg/l dissolved oxygen • For each model scenario, assess duration of time and areal extent of exposure • Develop indices to estimate relative, biological impact for different model scenarios • survival impairment-area-days (SAD) • biomass impairment-area-days (BAD)
Response to Low DO Percent Impairment at 0.5 mg/l DO Intervals - CTDEP Long Island Sound Finfish Survey - EPA Marine WQ Criteria for DO (Say Mud Crab)
Conclusions From Cost Curve and Model Analysis • Approximately 80% of the benefit (DO improvement) can be obtained for 25% of cost • Achievable reductions can greatly reduce the time and area affected by hypoxia • 75% reduction in area • 85% reduction in duration • Greatly reduce biological effects • effects on fish abundance: 95-100% • effects on larval mortality: 65-84%
Challenges to Traditional TMDL and Allocation Process • Use of cost-effectiveness • Phasing • Cost estimates vary • Incentive for dischargers to inflate • Impact on resources debated • Lack of incentives to do more, sooner
Use Flexibility and Market Forces to Achieve Efficient Allocations • Identify optimal reduction levels relative to cost • Cost-effective level of reduction at publicly owned treatments works • Aggressive nonpoint source pollution control program • Allocate equal reductions to each management zone and discharger • Allow flexibility in how to achieve reductions within a zone and among facilities considering relative impacts (equivalency factors) • bubble permit (NY) • general permit (CT) and credit trading
Nitrogen Reduction Goals Have Been Established • Nitrogen reduction targets established in 1998 • A Total Maximum Daily Load Analysis to Achieve Water Quality Standards for Dissolved Oxygen in Long Island Sound (2001) • 58.5 percent reduction to anthropogenic sources in the Connecticut and New York portions of the basin • Establishes WLAs and LAs • Establishes "equivalency factors" for relative effect on DO • additional reductions from out-of-basin sources (MA, VT, NH) and atmospheric deposition • identifies alternatives, i.e. aeration
Schedule for Achieving Reduction Targets • Achieve targets in 15 years • 40% in five years • 75% in ten years • Reevaluate every five years • assess system response • revise DO standards • establish out-of-basin nitrogen allocations • identifies alternatives, i.e. aeration, if needed
The TMDL Calls For: • A 58.5% Reduction from primary anthropogenic sources in CT and NY • 10% reduction from urban and agricultural runoff (LA) • Balance (65%) from point sources (WLA) 50 %
TMDL Trading Ratios • Adjustments in WLA allowed consistent with TMDL exchange ratios • Watershed attenuation factors • Delivery to LIS
Implementation: NY Bubble Permits • Nitrogen "bubble" by management zone • aggregate, annual limit for point sources within a zone • individual, annual limit based on facility's share of aggregate, annual load • Monitoring and reporting requirements • Compliance for 12-month rolling average • Final WLA phased in five-year increments • Reallocation among zones allowed consist with TMDL equivalency factors
How it Works • Option of doing more at upper East River STPS and less at lower East River STPs • 1.9:1.0 trading ratio • NYCDEP and NYSDEC modified consent order for Newtown Creek STP to eliminate nitrogen control • Estimated savings of $600 million • NYCDEP and NYSDEC signed consent order on upper ER nitrogen control to meet TMDL
Implementation: CT General Permit and Trading • Public Act No.01-180 (June 2001) • framework for Nitrogen Credit Exchange Program and Advisory Board • authorization for general permit for the discharge of nitrogen • General Permit (September 2001) • 79 POTWs get annual mass loading • phased in annually over 15 years to attain WLA • contains performance, monitoring, reporting, and trading requirements • opt-out option
How it Works • State finances upgrades • Facilities monitor and report on annual discharge • March 31 audit of calendar year discharge • Comply by... • meeting annual mass loading, or • purchasing credits equal to exceedance • State acts as banker • sells credits by July 31 • purchases credits by August 14
How it Works • State sets price of credits and administers and tracks transaction • Nitrogen Credit Advisory Board proposes value based on statewide cost of nitrogen reduction • No banking, no credit for grant portion (only loan) • Nonpoint sources not currently included in trading program, but desired outcome
0.17 0.14 0.32 0.19 0.46 0.18 0.93 1.00 0.11
100 50 80 40 20 100 50 40 10
Point Source Nitrogen Reductions The 1990 estimates include 98 municipal, 4 state, and 4 industrial discharges = 109 CTDEP adjusted its data in 2001 to include reports from plants not previously submitted and change estimates to actual reported numbers.
Maximum Area and Duration of Hypoxia (less than 3.0 mg/l) CT DEP LIS Water Quality Monitoring Program
Meanwhile… • 1992: NYCDEP initiates Systemwide Modeling • 1994-95: NYCDEP initiates comprehensive field program to add to 1988-89 data sets • 1999: Model Evaluation Group approves SWEM for LIS application • 2001: LISS Management Committee accepts use of SWEM to support hypoxia management program • NYCDEP provides SWEM for LISS use through HydroQual
And Now… • Systemwide Nutrients Work Group directs SWEM application • NY/NJ Harbor Estuary Program and LISS • Charged with providing recommendations on TMDL development and reassessment
Work Group Goals • By September 2004 prepare assessment: • Revised DO standards • Load estimates from atmospheric deposition and upstream sources • Technology advancements in N control • Exchange ratios of relative effects