Download
1 / 1
20 likes | 184 Vues
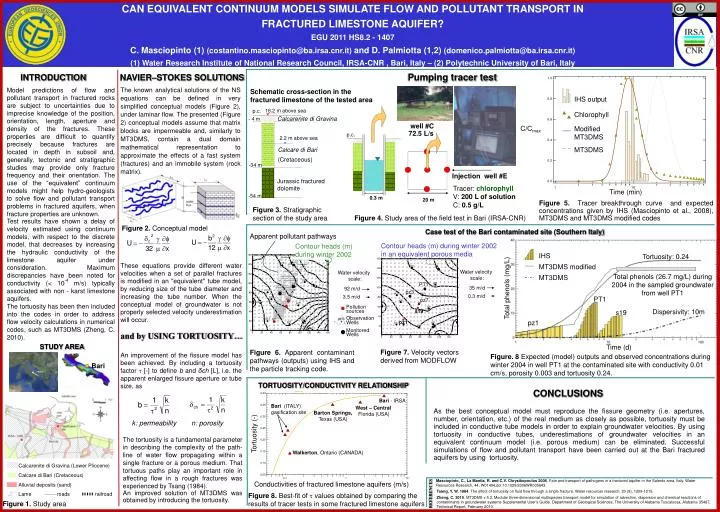
p.c. Calcarenite di Gravina. - 4 m. Water velocity scale:. Observation Wells. 92 m/d. Calcare di Bari. Pollution sources. (Cretaceous). 3.5 m/d. -34 m. Jurassic fractured dolomite. -54 m. Monitored Wells. Bari. Tortuosity (-). Bari - IRSA. Bari (ITALY) gasification site.

E N D
p.c. Calcarenite di Gravina - 4 m Water velocity scale: ObservationWells 92 m/d Calcare di Bari Pollution sources (Cretaceous) 3.5 m/d -34 m Jurassic fractured dolomite -54 m Monitored Wells Bari Tortuosity (-) Bari - IRSA Bari (ITALY) gasification site West – Central Florida (USA) Barton Springs, Texas(USA) Walkerton, Ontario (CANADA) Conductivities of fractured limestone aquifers (m/s) CAN EQUIVALENT CONTINUUM MODELS SIMULATE FLOW AND POLLUTANT TRANSPORT IN FRACTURED LIMESTONE AQUIFER? EGU 2011 HS8.2 - 1407 C. Masciopinto (1) (costantino.masciopinto@ba.irsa.cnr.it) and D. Palmiotta (1,2) (domenico.palmiotta@ba.irsa.cnr.it) (1) Water Research Institute of National Research Council, IRSA-CNR , Bari, Italy – (2) Polytechnic University of Bari, Italy Pumping tracer test INTRODUCTION NAVIER–STOKES SOLUTIONS Model predictions of flow and pollutant transport in fractured rocks are subject to uncertainties due to imprecise knowledge of the position, orientation, length, aperture and density of the fractures. These properties are difficult to quantify precisely because fractures are located in depth in subsoil and, generally, tectonic and stratigraphic studies may provide only fracture frequency and their orientation. The use of the “equivalent” continuum models might help hydro-geologists to solve flow and pollutant transport problems in fractured aquifers, when fracture properties are unknown. Test results have shown a delay of velocity estimated using continuum models, with respect to the discrete model, that decreases by increasing the hydraulic conductivity of the limestone aquifer under consideration. Maximum discrepancies have been noted for conductivity (< 10-4 m/s) typically associated with non - karst limestone aquifers. The tortuosity has been then included into the codes in order to address flow velocity calculations in numerical codes, such as MT3DMS (Zheng, C. 2010). The known analytical solutions of the NS equations can be defined in very simplified conceptual models (Figure 2), under laminar flow. The presented (Figure 2) conceptual models assume that matrix blocks are impermeable and, similarly to MT3DMS, contain a dual domain mathematical representation to approximate the effects of a fast system (fractures) and an immobile system (rock matrix). Schematic cross-section in the fractured limestone of the tested area IHS output 16.2 m above sea Chlorophyll well #C C/Cmax Modified MT3DMS 72.5 L/s p.c. 2.2 m above sea MT3DMS Injection well #E Tracer:chlorophyll V: 200 L of solutionC: 0.5 g/L Time (min) 0.3 m 20 m Figure 5. Tracer breakthrough curve and expected concentrations given by IHS (Masciopinto et al., 2008), MT3DMS and MT3DMS modified codes Figure 3. Stratigraphic section of the study area Figure 4. Study area of the field test in Bari (IRSA-CNR) Figure 2. Conceptual model Case test of the Bari contaminated site(Southern Italy) Apparent pollutant pathways Total phenols (mg/L) Contour heads (m) during winter 2002 in an equivalent porous media Contour heads (m) during winter 2002 IHS Tortuosity: 0.24 These equations provide different water velocities when a set of parallel fractures is modified in an "equivalent" tube model, by reducing size of the tube diameter and increasing the tube number. When the conceptual model of groundwater is not properly selected velocity underestimation will occur. MT3DMS modified Water velocity scale: Total phenols (26.7 mg/L) during 2004 in the sampled groundwater from well PT1 MT3DMS PT1 35 m/d pz3 0.3 m/d PT1 pz7 Dispersivity: 10m s19 s19 pz1 pz1 and by USING TORTUOSITY… STUDY AREA Time (d) Figure 6. Apparent contaminant pathways (outputs) using IHS and the particle tracking code. Figure 7. Velocity vectors derived from MODFLOW An improvement of the fissure model has been achieved. By including a tortuosity factor [-] to define b and δch [L], i.e. the apparent enlarged fissure aperture or tube size, as Figure. 8 Expected (model) outputs and observed concentrations during winter 2004 in well PT1 at the contaminated site with conductivity 0.01 cm/s, porosity 0.003 and tortuosity 0.24. TORTUOSITY/CONDUCTIVITY RELATIONSHIP CONCLUSIONS As the best conceptual model must reproduce the fissure geometry (i.e. apertures, number, orientation, etc.) of the real medium as closely as possible, tortuosity must be included in conductive tube models in order to explain groundwater velocities. By using tortuosity in conductive tubes, underestimations of groundwater velocities in an equivalent continuum model (i.e. porous medium) can be eliminated. Successful simulations of flow and pollutant transport have been carried out at the Bari fractured aquifers by using tortuosity. k: permeability n: porosity The tortuosity is a fundamental parameter in describing the complexity of the path-line of water flow propagating within a single fracture or a porous medium. That tortuous paths play an important role in affecting flow in a rough fractures was experienced by Tsang (1984). An improved solution of MT3DMS was obtained by introducing the tortuosity. Calcarenite di Gravina (Lower Pliocene) Calcare di Bari (Cretaceous) Masciopinto, C., La Mantia, R. and C.V. Chrysikopoulos 2008. Fate and transport of pathogens in a fractured aquifer in the Salento area, Italy. Water Resources Research, 44, W01404,doi:10.1029/2006WR005643. Alluvial deposits (sand) Tsang, Y. W. 1984. The effect of tortuosity on fluid flow through a single fracture. Water resources research, 20 (9), 1209-1215. REFERENCES Lame roads railroad Figure8. Best-fit of values obtained by comparing the results of tracer tests in some fractured limestone aquifers Zheng, C. 2010. MT3DMS v 5.3: Modular three-dimensional multispecies transport model for simulation of advection, dispersion and chemical reactions of contaminants in groundwater systems Supplemental User’s Guide. Department of Geological Sciences, The University of Alabama Tuscaloosa, Alabama 35487, Technical Report, February 2010. Figure 1. Study area