Download
1 / 3

E N D
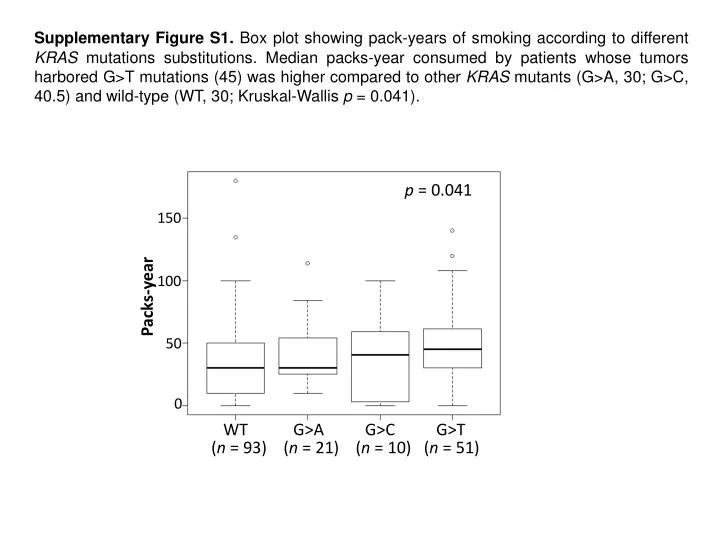
Supplementary Figure S1.Box plot showing pack-years of smoking according to different KRAS mutations substitutions. Median packs-year consumed by patients whose tumors harbored G>T mutations (45) was higher compared to other KRAS mutants (G>A, 30; G>C, 40.5) and wild-type (WT, 30; Kruskal-Wallis p = 0.041). p = 0.041 150 Packs-year 100 50 0 WT G>A G>C G>T (n = 93) (n = 21) (n = 10) (n = 51)
Supplementary Figure S2. Kaplan-Meier plots of disease-free survival (DFS) and overall survival (OS) according to distinct KRAS codon variants. Patients harboring KRAS-G12C mutation had significantly shorter DFS and OS compared to KRAS wild-type or other codon variants of KRAS. (A) Patients harboring KRAS-G12C mutations had significantly worse DFS rate at 2 years (42.9% ± 8.4) as compared to other KRAS mutants (G12A, 75% ± 15.3; G12V, 78.6% ± 11.0; G12D, 53.3% ± 12.9) and wild-type (73.4% ± 4.6). (B) Concordantly, patients with KRAS-G12C mutations had significantly worse OS rate at 2 years (60% ± 8.3) as compared to other mutants (G12A, 87.5% ± 11.7; G12V, 92.9% ± 6.9; G12D, 86.7% ± 8.8) and wild-type (79.6% ± 4.2). Wild-type (n = 94) KRAS G12C (n = 35) KRAS G12D (n = 15) KRAS G12V (n = 14) KRASG12A (n = 8) Wild-type (n = 94) KRAS G12C (n = 35) KRAS G12D (n = 15) KRAS G12V (n = 14) KRASG12A (n = 8) 1.0 1.0 Log-rank test p < 0.001 Log-rank test p = 0.004 0.8 0.8 0.6 0.6 Overall survival (%) Disease-free survival (%) 0.4 0.4 0.2 0.2 0.0 0.0 Log-rank test P < 0.001 0 10 20 30 40 50 60 0 10 20 30 40 50 60 Months after surgery Months after surgery
Supplementary Figure S3. Kaplan-Meier plots of overall survival (OS) according to KRAS codon variant from TCGA-LUAD cohort. Patients with tumors harboring KRAS-G12C had significantly shorter median overall survival (32.9 months) as compared to KRAS-nonG12C (not reached; unadjusted HR = 3.26, CI 95% 1.06-10.04, p = 0.039). Interestingly, KRAS-G12C was significantly associated with worse survival in the multivariate analysis adjusted by stage and adjuvant treatment (HR =10.16, 95% CI 2.19 – 47.11, p = 0.003). 1.0 KRAS-nonG12C (n = 35) 0.8 0.6 Overall survival (%) 0.4 KRAS-G12C (n = 32) 0.2 0.0 HR = 3.26, p = 0.039 0 10 20 30 40 50 60 Months after surgery