Download
1 / 1
10 likes | 101 Vues
Protected Areas. Global Socioeconomic Data for Understanding Human Impacts on Biodiversity. Urban Extents and Ecosystems

E N D
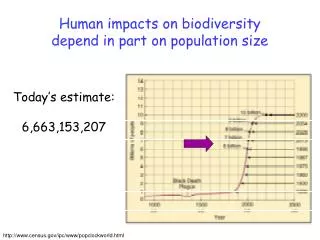
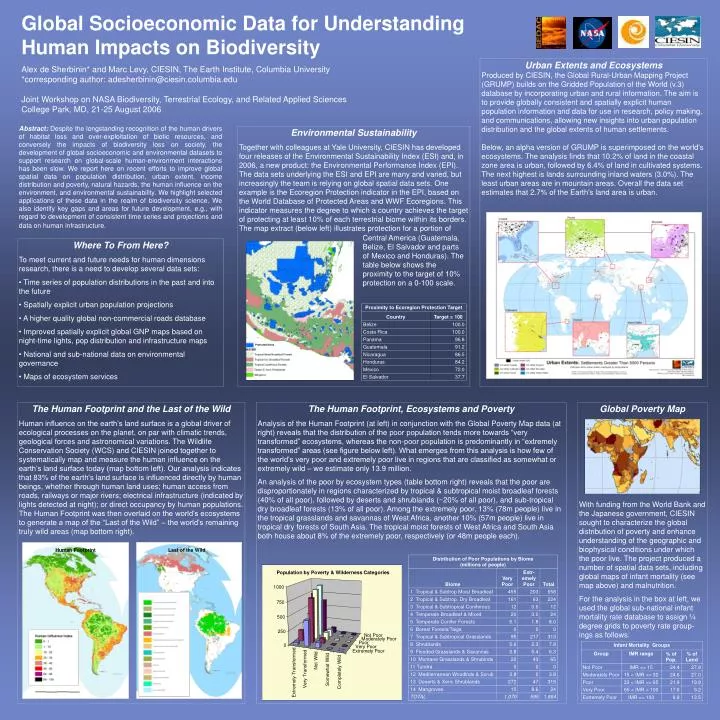
Protected Areas Global Socioeconomic Data for Understanding Human Impacts on Biodiversity Urban Extents and Ecosystems Produced by CIESIN, the Global Rural-Urban Mapping Project (GRUMP) builds on the Gridded Population of the World (v.3) database by incorporating urban and rural information. The aim is to provide globally consistent and spatially explicit human population information and data for use in research, policy making, and communications, allowing new insights into urban population distribution and the global extents of human settlements. Below, an alpha version of GRUMP is superimposed on the world's ecosystems. The analysis finds that 10.2% of land in the coastal zone area is urban, followed by 6.4% of land in cultivated systems. The next highest is lands surrounding inland waters (3.0%). The least urban areas are in mountain areas. Overall the data set estimates that 2.7% of the Earth's land area is urban. Alex de Sherbinin* and Marc Levy, CIESIN, The Earth Institute, Columbia University *corresponding author: adesherbinin@ciesin.columbia.edu Joint Workshop on NASA Biodiversity, Terrestrial Ecology, and Related Applied Sciences College Park, MD, 21-25 August 2006 Abstract:Despite the longstanding recognition of the human drivers of habitat loss and over-exploitation of biotic resources, and conversely the impacts of biodiversity loss on society, the development of global socioeconomic and environmental datasets to support research on global-scale human-environment interactions has been slow. We report here on recent efforts to improve global spatial data on population distribution, urban extent, income distribution and poverty, natural hazards, the human influence on the environment, and environmental sustainability. We highlight selected applications of these data in the realm of biodiversity science. We also identify key gaps and areas for future development, e.g., with regard to development of consistent time series and projections and data on human infrastructure. Environmental Sustainability Together with colleagues at Yale University, CIESIN has developed four releases of the Environmental Sustainability Index (ESI) and, in 2006, a new product: the Environmental Performance Index (EPI). The data sets underlying the ESI and EPI are many and varied, but increasingly the team is relying on global spatial data sets. One example is the Ecoregion Protection indicator in the EPI, based on the World Database of Protected Areas and WWF Ecoregions. This indicator measures the degree to which a country achieves the target of protecting at least 10% of each terrestrial biome within its borders. The map extract (below left) illustrates protection for a portion of Central America (Guatemala, Belize, El Salvador and parts ofMexico and Honduras). The table below shows the proximity to the target of 10% protection on a 0-100 scale. • Where To From Here? • To meet current and future needs for human dimensions research, there is a need to develop several data sets: • Time series of population distributions in the past and into the future • Spatially explicit urban population projections • A higher quality global non-commercial roads database • Improved spatially explicit global GNP maps based on night-time lights, pop distribution and infrastructure maps • National and sub-national data on environmental governance • Maps of ecosystem services The Human Footprint and the Last of the Wild Human influence on the earth’s land surface is a global driver of ecological processes on the planet, on par with climatic trends, geological forces and astronomical variations. The Wildlife Conservation Society (WCS) and CIESIN joined together to systematically map and measure the human influence on the earth’s land surface today (map bottom left). Our analysis indicates that 83% of the earth's land surface is influenced directly by human beings, whether through human land uses; human access from roads, railways or major rivers; electrical infrastructure (indicated by lights detected at night); or direct occupancy by human populations. The Human Footprint was then overlaid on the world’s ecosystems to generate a map of the “Last of the Wild” – the world’s remaining truly wild areas (map bottom right). The Human Footprint, Ecosystems and Poverty Analysis of the Human Footprint (at left) in conjunction with the Global Poverty Map data (at right) reveals that the distribution of the poor population tends more towards “very transformed” ecosystems, whereas the non-poor population is predominantly in “extremely transformed” areas (see figure below left). What emerges from this analysis is how few of the world’s very poor and extremely poor live in regions that are classified as somewhat or extremely wild – we estimate only 13.9 million. An analysis of the poor by ecosystem types (table bottom right) reveals that the poor are disproportionately in regions characterized by tropical & subtropical moist broadleaf forests (40% of all poor), followed by deserts and shrublands (~20% of all poor), and sub-tropical dry broadleaf forests (13% of all poor). Among the extremely poor, 13% (78m people) live in the tropical grasslands and savannas of West Africa, another 10% (57m people) live in tropical dry forests of South Asia. The tropical moist forests of West Africa and South Asia both house about 8% of the extremely poor, respectively (or 48m people each). Global Poverty Map With funding from the World Bank and the Japanese government, CIESIN sought to characterize the global distribution of poverty and enhance understanding of the geographic and biophysical conditions under which the poor live. The project produced a number of spatial data sets, including global maps of infant mortality (see map above) and malnutrition. For the analysis in the box at left, we used the global sub-national infant mortality rate database to assign ¼ degree grids to poverty rate group-ings as follows: Human Footprint Last of the Wild Population by Poverty & Wilderness Categories