Download
1 / 42
1.19k likes | 2.86k Vues
VENTRICULAR PRESSURE VOLUME LOOP. Dr. G. Gnanavelu , MD, DM Associate Professor and Head Department of Cardiology Kilpauk Medical College Chennai. CARDIAC CYCLE. VENTRICULAR PRESSURE VOLUME LOOP. ESPVR. AoV closes. LV pressure (mmHg). AoV opens. MV closes. MV opens. EDPVR.

E N D
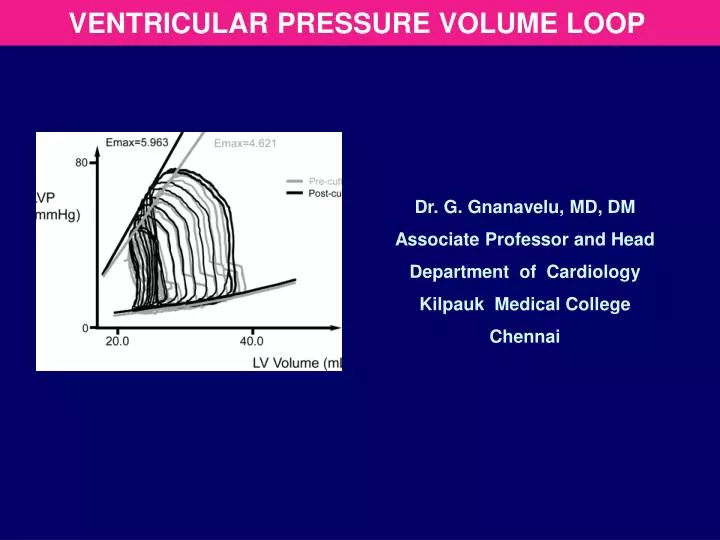
VENTRICULAR PRESSURE VOLUME LOOP Dr. G. Gnanavelu, MD, DM Associate Professor and Head Department of Cardiology KilpaukMedical College Chennai
VENTRICULAR PRESSURE VOLUME LOOP ESPVR AoV closes LV pressure (mmHg) AoV opens MV closes MV opens EDPVR LV volume (ml) PRESSURE & VOLUME MEASUREMENT Conductance catheter Volume by echo Pressure by high fidelity manometer APPLICATION Clinical tool; Experimental 200 100 0 0 100 200
AoV closes LV pressure (mmHg) AoVopens MV closes MV opens LV volume (ml) GENERATION OF PRESSURE VOLUME LOOP 1 = MV closing point 2 = MV opening point 3 = Ao V closing point 4 = Ao V opening point a = Diastole b = Isovolumic contraction c = Systole d = Isovolumic relaxation c 200 100 0 3 2 stroke volume d b 1 a 4 0 100 200
DETERMINANTS OF VENTRICULAR FUNCTION Preload: initial stretching of the cardiac myocytes prior to contraction. clinical index: end diastolic volume or end diastolic pressure Afterload: the load against which the ventricle ejects clinical index: Aortic pressure (in the absence of LVOT obstruction) or precisely wall stress Contractility:the intrinsic ability of a cardiac muscle fibre to contract at a given fibre length. Heart rate
FRANK-STARLING CURVE 100 50 0 100 50 0 B INCREASED VENOUS RETURN A SV (ml) SV (ml) C DECREASED VENOUS RETURN 0 10 20 0 10 20 LVEDP (mmHg) normal ‘Stroke volume increases proportionately with preload within physiologic limits’
FAMILY OF FRANK STARLING CURVES 100 50 0 100 50 0 SV (ml) SV (ml) 0 10 20 0 10 20 LVEDP (mmHg) Afterload Inotropy Afterload Inotropy ‘Increased afterload and decreased inotropy shifts the curve downward – SV decreases’ ‘Decreased afterload and increased inotropy shifts the curve upwards – SV increases’
INOTROPY & FORCE VELOCITY RELATIONSHIP Shortening velocity Normal Increased inotropy Decreased inotropy Afterload (force) As afterload increases; shortening velocity decreases -- SV decreases; As afterload decreases, shortening velocity increases – SV increases; At a given afterload; increasing inotropy increases shortening velocity;
PRELOAD & FORCE VELOCITY RELATIONSHIP Shortening velocity Increasing preload a c c b a Afterload (Force) As afterload increases; shortening velocity decreases -- SV decreases; As afterload decreases, shortening velocity increases – SV increases; At a given afterload; increasing preload increases shortening velocity;
VENTRICULAR COMPLIANCE CURVE 100 50 0 LV pressure (mmHg) Decreased compliance normal EDP 0 100 200 EDV DIASTOLIC PRESSURE VOLUME RELATIONSHIP Increased compliance ‘Slope of the curve is stiffness; Compliance is the inverse of the slope’ ‘As compliance decreases; filling pressure increases’
END SYSTOLIC PRESSURE VOLUME RELATIONSHIP inotropy ESPVR normal inotropy LV pressure (mmHg) 200 100 0 EDPVR LV volume (ml) 0 100 200
NORMAL PRESSURE VOLUME LOOP ESPVR AoV closes LV pressure (mmHg) AoV opens MV closes MV opens EDPVR LV volume (ml) systole 200 100 0 IVC IVR Normal IVR & IVC diastole 0 100 200 Abnormal IVR & IVC
INCREASED PRELOAD INCREASED PRELOAD DECREASED PRELOAD DECREASED PRELOAD 200 100 0 200 100 0 L V pressure (mm Hg) L V pressure (mm Hg) 0 100 200 0 100 200 EDV EDV ESV ESV LV volume (ml) LV volume (ml) CHANGES IN PRELOAD AND STROKE VOLUME Primary change: EDV increases; SV increases Secondary change : ESV increases minimally Primary change: EDV decreases; SV dereases Secondary change : ESV decreases minimally
INCREASED AFTERLOAD INCREASED AFTERLOAD DECREASED AFTERLOAD DECREASED AFTERLOAD 200 100 0 200 100 0 L V pressure (mm Hg) L V pressure (mm Hg) 0 100 200 0 100 200 EDV EDV ESV ESV LV volume (ml) LV volume (ml) CHANGES IN AFTERLOAD AND STROKE VOLUME Primary change: ESV increases; SV decreases Secondary change : EDV increases minimally Primary change: ESV decreases; SV increases Secondary change : EDV decreases minimally
CHANGES IN INOTROPY AND STROKE VOLUME INCREASED INOTROPY DECREASED INOTROPY 200 100 0 200 100 0 L V pressure (mm Hg) L V pressure (mm Hg) 0 100 200 0 100 200 EDV EDV ESV ESV LV volume (ml) LV volume (ml) Primary change: ESV decreases; SV increases Secondary change : EDV decreases minimally Primary change: ESV increases; SV decreases Secondary change : EDV increases minimally
ABNORMAL PRESSURE VOLUME LOOP ESPVR AoV closes LV pressure (mmHg) AoV opens MV closes MV opens EDPVR LV volume (ml) • Identified by • Change in EDPVR & EDP • Change in ESPVR & pressure • at which AoV closes • Change in Stroke volume • Curved IVC & IVR line • Overall shape of PV loop systole 200 100 0 IVC IVR diastole 0 100 200
SYSTOLIC DYSFUNCTION 200 100 0 100 50 0 loss of inotropy L V pressure (mm Hg) Stroke volume (ml) NORMAL SYSTOLIC DYSFUNCTION VASODILATORS 0 100 200 0 10 20 30 EDV ESV LV volume (ml) LV EDP (mm Hg) Loss of inotropy shifts ESPVR downwards; ESV increases, Compensatory increase in EDV to some extent; SV decreases. Frank Starling curve : shifts downwards; EDP increases. SV falls; With vasodilator therapy, SV improves; EDP is reduced.
DIASTOLIC DYSFUNCTION 200 100 0 L V pressure (mm Hg) 100 50 0 LV pressure (mmHg) Decreased compliance normal EDP 0 100 200 EDV LV volume (ml) 0 100 200 EDV ESV LV volume (ml) eg. LVH; compliance curve shifts up. EDP increases and SV decreases. Careful use of diuretics will be of use; because some degree of raised venous pressure is necessary to fill less compliant ventricle.
200 100 0 L V pressure (mm Hg) 0 100 200 EDV ESV LV volume (ml) MITRAL STENOSIS Decrease in EDV since there is reduced filling. SV decreases, fall in CO and Aortic pressure. Afterload is decreased so ESV also decreases to some extent.
200 100 0 L V pressure (mm Hg) 0 100 200 EDV ESV LV volume (ml) AORTIC STENOSIS Afterload is very much increased, so ESV increases and SV decreases As ESV increases, residual volume is added to venous return, so EDV increases. Increased preload increases force of contraction and maintains SV to some extent Diuretics are deleterious in this situation
CHRONIC AORTIC REGURGITATION 200 100 0 No true Isovolumic contraction and relaxation EDV increases greatly. This increases Stroke volume and cardiac output. Afterload increases hence ESV also increases to some extent. Once systolic dysfunction sets in, ESV increases progressively and peak systolic pressure & SV fall L V pressure (mm Hg) 0 100 200 EDV ESV LV volume (ml)
ACUTE AORTIC REGURGITATION 200 100 0 L V pressure (mm Hg) 0 100 200 EDV ESV LV volume (ml) Ventricular diastolic volume increases suddenly EDV and EDP increases PV loop appears small No true isovolumic relaxation SV falls
CHRONIC MITRAL REGURGITATION 200 100 0 L V pressure (mm Hg) 0 100 200 EDV ESV LV volume (ml) EDV increases No true isovolumic contraction and relaxation Afterload is reduced, so ESV is reduced Net effect = SV increases With systolic dysfunction; ESV increases, forward stroke volume decreases
ACUTE MITRAL REGURGITATION 200 100 0 L V pressure (mm Hg) 0 100 200 EDV ESV LV volume (ml) Ventricular volume increases abruptly No true isovolumic contraction EDP rapidly increases PV loop appears small
200 100 0 L V pressure (mm Hg) 0 100 200 EDV ESV LV volume (ml) CARDIAC TAMPONADE Unique PV loop Preload is greatly decreased; EDP is elevated ESV is also decreased Stroke volume is decreased
LV pressure (mmHg) LV volume (ml) PV LOOP - QUIZ Where does Aortic valve close? Point 1 Point 2 Point 3 4. Point 4 c 200 100 0 3 2 d b 1 a 4 0 100 200
LV pressure (mmHg) LV volume (ml) PV LOOP - QUIZ Where does Mitral valve open? Point 1 Point 2 Point 3 4. Point 4 c 200 100 0 3 2 d b 1 a 4 0 100 200
LV pressure (mmHg) LV volume (ml) PV LOOP - QUIZ Which portion of the loop is systole Shaded area Unshaded area 200 100 0 0 100 200
LV pressure (mmHg) LV volume (ml) PV LOOP - QUIZ What is the abnormality ? Why ? 200 100 0 0 100 200
200 100 0 L V pressure (mm Hg) 0 100 200 EDV ESV LV volume (ml) PV LOOP - QUIZ What does the blue line with arrows indicate? Cardiac output Stroke volume Stroke work Kinetic energy
200 100 0 L V pressure (mm Hg) 0 100 200 EDV ESV LV volume (ml) INTERPRETING PV LOOP 30 yr old male Hb 8 gms% C/o SOB & palpitation BP 130/70 What is the abnormality?
200 100 0 L V pressure (mm Hg) 0 100 200 EDV ESV LV volume (ml) INTERPRETING PV LOOP What has caused the change in the shaded pressure volume loop? Intravenous fluids Diuretics ACE inhibitors Dobutamine
200 100 0 L V pressure (mm Hg) 0 100 200 EDV ESV LV volume (ml) INTERPRETING PV LOOP What has caused the change in the shaded pressure volume loop? Intravenous fluids Diuretics ACE inhibitors Dobutamine
200 100 0 L V pressure (mm Hg) 0 100 200 EDV ESV LV volume (ml) INTERPRETING PV LOOP 30 yr old male With acute gastroenteritis Pulse thready and rapid BP 80 systolic Clear lungs What is the abnormality in PV loop ?
200 100 0 L V pressure (mm Hg) 0 100 200 EDV ESV LV volume (ml) INTERPRETING PV LOOP 50 yr old male Hypertensive Old ASMI c/o SOB Class III BP 150/100 ECHO: RWMA; EF 38% What are the changes seen in Colored PV Loop?
INTERPRETING PV LOOP 200 100 0 Same patient After three months of drugs SOB Class III BP 120/80 ECHO: RWMA; EF 45% What are the drugs which have caused the changes in PV loop? L V pressure (mm Hg) After drugs Before drugs 0 100 200 EDV ESV LV volume (ml)
200 100 0 L V pressure (mm Hg) 0 100 200 EDV ESV LV volume (ml) INTERPRETING PV LOOP 65 yr. old female Hypertensive c/o SOB Class III BP 160/100 S4 Bil. basal rales ECHO: Mod. Conc. LVH EF 60% Why is the patient dyspneic on exertion?
200 100 0 L V pressure (mm Hg) 0 100 200 EDV ESV LV volume (ml) INTERPRETING PV LOOP 25 yr. old male Bicuspid aortic valve No RF delay BP 140/70 What are the hemodynamic changes seen in PV loop? What are the lesions?
200 100 0 L V pressure (mm Hg) 0 100 200 EDV ESV LV volume (ml) INTERPRETING PV LOOP 60 year old male Calcific aortic stenosis – severe (blue PV loop) After 3 years – (green PV loop) What are the changes? What will be the clinical findings?