Download

1 / 28
340 likes | 487 Vues
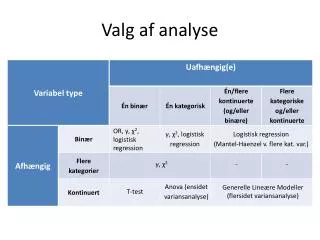
ANOVA & Regression. Selecting the Correct Statistical Test. Analysis of Variance. Is used when you want to compare means for three or more groups. You have a normal distribution (random sample or population). It can be used to determine causation.

E N D
ANOVA & Regression Selecting the Correct Statistical Test
Analysis of Variance • Is used when you want to compare means for three or more groups. • You have a normal distribution (random sample or population). • It can be used to determine causation. • It contains an independent variable that is nominal and a dependent variable that is interval/ratio.
Other properties of both t-test and ANOVA • Assumes equal variance (equal size or number of observations in each group). • Samples for both t-test and ANOVA should be “independent” - this means that separate groups should have different members. Memberships should not overlap between groups. • Calculations are based on degrees of freedom. (You will see degrees of freedom on the SPSS print out. DF for t-test is n (number of observations – 1).
As with chi-square, degrees of freedom represent: • Ability of numbers in the data set to vary. • DF in ANOVA is a bit more complex. Calculations are based on the difference in means between each group and within each group. • Therefore Degrees of Freedom between groups are n (number of groups). • Degrees of Freedom within groups are the number of observations in each group (n) – 1, then you add the total degrees of freedom for each group.
For example, if we had three groups for whom we have scores on the Depression Test
Degrees of Freedom • Between Groups = (n –1) = 3 –1 = 2 • Within Groups = Sum of (n-1) for each group (7-1) + (6-1) + (5-1) = 6 + 5 + 4 = 15
Testing a Hypothesis with ANOVA • If our confidence level is .01 • Alternative Hypothesis: Ethnicity is associated with years of education completed • Null hypothesis: There is no association between ethnicity and years of education completed. • F = 13.746 p = .000 Do we confirm or reject the null hypothesis?
Regression Analysis: • Allows us to look at causation using two interval/ratio variables. • Involves predicting the value of the dependent variable using the independent variable. Other control variables can be added to the regression analysis.
Calculation for Regression is based on: • The concept of the regression line. What points in the association between two variables are on or off the regression line. • For simple or two variable regression: y = a + bx where a = the y-intercept and b = the slope of the line. Slope = the amount y increases for each unit of the increase in X. X = the x (independent variable value) used to predict Y (dependent variable value)
Regression line when looking at association between two variables
Control Variables are Those variables that when combined with the independent variable may affect the value of the dependent variable. For example when we look at the association between beginning salary and current salary, both age and gender may affect salary amounts
Let’s check on what this means about minority classification and salary
Hypothesis Testing: • Confidence level: = .05 • Alternative Hypothesis is: Controlling for minority status, beginning salary is associated (or can predict) current salary. • Null hypothesis is. Controlling for minority status, beginning salary is not associated (or can predict) current salary.
Analyzing regression Can use three values to interpret – (1) R2 - Correlation between any independent and control variables and the dependent variable. • F – goodness of fit of the regression line. Calculated based on the number of points off the line. • b – measure of the correlation between one variable in the regression model and the dependent variable. This is used when you include multiple independent or control variables in the model.
Hypothesis Test (continued) Total correlation between the independent and control variables and the dependent variables = R2 = .776 (note no p value – but the closer the R2 is to 1.00 the better. This means that there is a high correlation between minority classification and beginning salary combined and current salary. Total fit of the model to the regression line = F = 816, p. = .00 (less than our confidence level of .05) Alternative hypothesis confirmed Individual Beta values for beginning salary (.874 at p. = .00 and minority status (.040 at p = .073). At p. = .05 CL only beginning salary is statistically significant or associated with current salary.
General rules for analyzing results • The bigger the test statistic the more likely there is a relationship between the independent and dependent variables. Values greater than 3 are for every type of inferential statistic other than correlation are usually statistically significant. • Relationships can be positive or negative. You need the p value to determine if the test statistic is actually large enough to be statistically significant. You must always set a confidence level before determining if the p value is large enough to be statistically significant. • Findings from small samples are unlikely to be significant unless there is a very strongrelationship between two variables.
How do we write up test results • We use the test statistic and the probability level. • Correct procedure for professional journal articles also requires the use of degrees of freedom and number of observations. • For Assignment #4 use the test statistic and the probability level.
Proper format for this class • The confidence level is p. = .05. Reject the null hypothesis and accept the alternative hypothesis. Correlation is r = .74 at p. = .04. • The confidence level is p. = .10.Accept the null hypothesis and reject the alternative hypothesis. There is no association between years of education and salary, controlling for gender; F = .45, p. = .70.
Criteria for Using Statistical Tests • Independent samples • Level of Measurement • Normal distribution • Sample Size (Minimum for quantitative research should be 30) • Robustness (can procedure be used when basic assumptions are violated?) T-test, ANOVA, and chi-square are considered very robust.
Research note: • Some types of ordinal data can be used as interval/ratio data in statistical analysis. Montcalm and Royse state that such data should be ranked at a least five levels, come from a normal distribution, and result from a large sample. • The most common type of ordinal data used as ratio/interval data in statistics is a likert scale.
Example of a likert scale • 1 = Very satisfied • 2 = Satisfied • 3 = Neutral • 4 = Unsatisfied • 5 = Very unsatisfied. Usually presented as a ranking ( 1 to 5), implies an equal distance among the categories.
If you do not have a random sample, it is proper to use nonparametric statistics: • Small sample size. • No normal distribution or random sampling. • More than one mode. • Many outliers in the data set. • Dependent variables are ordinal or dichotomous.
SPSS Instructions for Running ANOVA • Select Means • Select One-way ANOVA • Highlight your dependent variable (must be ratio) • Click on the arrow • Highlight your factor (independent) variable (must be nominal with at least three categories) • Click o.k.
SPSS instructions for running Regression • Select Analyze • Select Regression • Select Linear • Highlight Dependent Variable (must be ratio) • Highlight two or independent or control variables • Click on Arrow • Click o.k.
SPSS Instructions for Running Means • Select Analyze • Select Compare Means • Select Means • Highlight Dependent (Ratio) Variable • Highlight Independent (Nominal) Variable • Click ok