Download
1 / 18
200 likes | 669 Vues
Objectives. Write and graph piecewise functions. Use piecewise functions to describe real-world situations. Vocabulary. piecewise function step function. Notes #1-2. A) Create a table for the two pieces B)Graph the function. –3 x if x < 2. g ( x ) =. x + 3 if x ≥ 2.

E N D
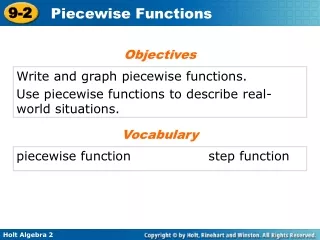
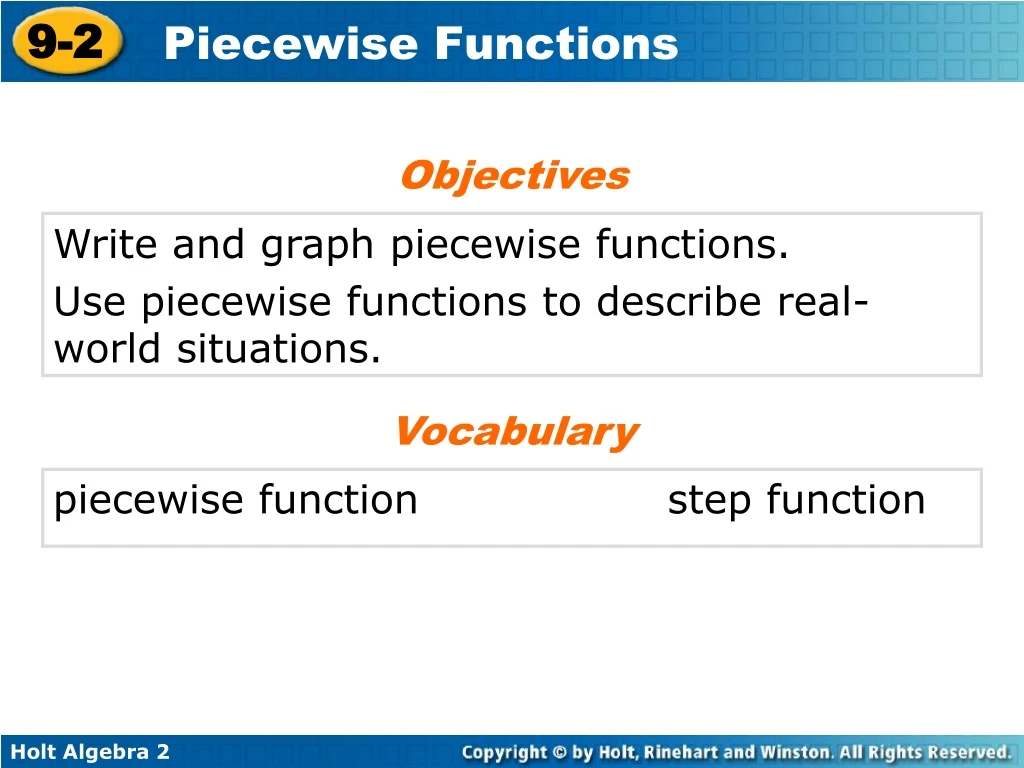
Objectives Write and graph piecewise functions. Use piecewise functions to describe real-world situations. Vocabulary piecewise function step function
Notes #1-2 • A) Create a table for the two pieces • B)Graph the function. –3x if x < 2 g(x) = x + 3 if x ≥ 2 2. Write and graph a piecewise function for the following situation. A house painter charges $12 per hour for the first 40 hours he works, time and a half for the 10 hours after that, and double time for all hours after that. How much does he earn for a 70-hour week?
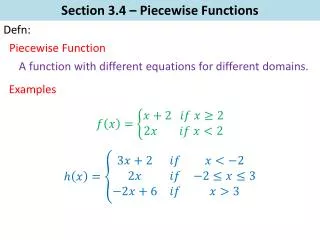
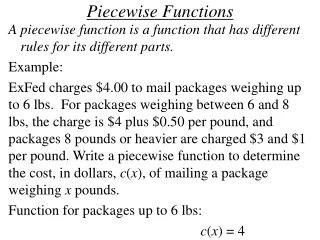
A piecewise function is a function that is a combination of one or more functions. The rule for a piecewise function is different for different parts, or pieces, of the domain. For instance, fees for golfing can be different depending on the time of day. So the function for fees would assign a different value (green fee) for each domain interval (time).
Example 1: Consumer Application Create a table and a verbal description to represent the graph. Step 1 Create a table Because the endpoints of each segment of the graph identify the intervals of the domain, use the endpoints and points close to them as the domain values in the table.
Example 1 Continued The domain of the function is divided into three intervals: [0, 2) Weights under 2 Weights 2 and under 5 [2, 5) [5, ∞) Weights 5 and over
Example 1 Continued Step 2 Write a verbal description. Mixed nuts cost $8.00 per pound for less than 2 lb, $6.00 per pound for 2 lb or more and less than 5 lb, and $5.00 per pound for 5 or more pounds.
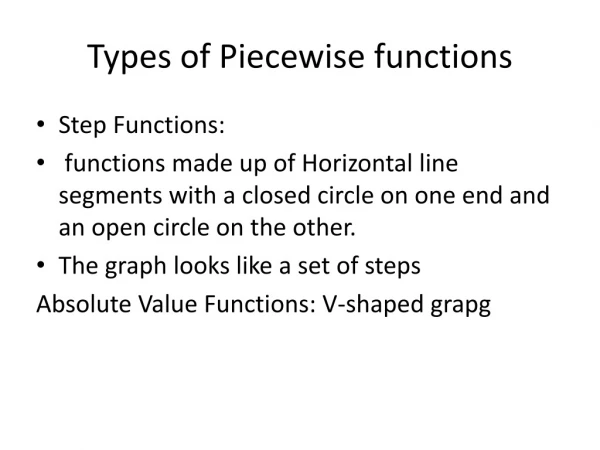
A piecewise function that is constant for each interval of its domain, such as the ticket price function, is called a step function. You can describe piecewise functions with a function rule. The rule for the movie ticket prices from Example 1 on page 662 is shown.
Read this as “f of x is 5 if x is greater than 0 and less than 13, 9 if x is greater than or equal to 13 and less than 55, and 6.5 if x is greater than or equal to 55.”
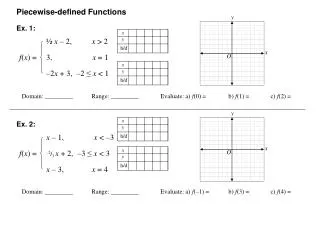
Example 2A: Evaluating a Piecewise Function Evaluate each piecewise function for x = –1 and x = 4. 2x + 1 if x ≤ 2 h(x) = x2 – 4 if x > 2 Because –1 ≤ 2, use the rule for x ≤ 2. h(–1) = 2(–1) + 1 = –1 Because 4 > 2, use the rule for x > 2. h(4) = 42 – 4 = 12
Example 2B Evaluate each piecewise function for x = –1 and x = 3. 12 if x < –3 15 if –3 ≤ x < 6 f(x) = 20 if x ≥ 6 Because –3 ≤ –1 < 6, use the rule for –3 ≤ x < 6 . f(–1) = 15 Because –3 ≤ 3 < 6, use the rule for –3 ≤ x < 6 . f(3) = 15
You can graph a piecewise function by graphing each piece of the function.
1 4 Example 3A: Graphing Piecewise Functions Graph each function. x + 3 if x < 0 g(x) = –2x + 3 if x ≥ 0 The function is composed of two linear pieces that will be represented by two rays. Because the domain is divided by x = 0, evaluate both branches of the function at x = 0.
Example 3A Continued For the first branch, the function is 3 when x = 0, so plot the point (0, 3) with an open circle and draw a ray with the slope 0.25 to the left. For the second branch, the function is 3 when x = 0, so plot the point (0, 3) with a solid dot and draw a ray with the slope of –2 to the right. ● O
1 2 Example 3B: Graphing Piecewise Functions Graph each function. x2 – 3 if x < 0 x – 3 if 0 ≤ x < 4 g(x) = (x – 4)2 – 1 if x ≥ 4 The function is composed of one linear piece and two quadratic pieces. The domain is divided at x = 0 and at x = 4.
Example 3B Continued No circle is required at (0, –3) and (4, –1) because the function is connected at those points.
Notes #1 • A) Create a table for the two pieces • B)Graph the function. –3x if x < 2 g(x) = x + 3 if x ≥ 2 The function is composed of two linear pieces. The domain is divided at x = 2.
Notes #1 ● O Add an open circle at (2, –6) and a closed circle at (2, 5) and so that the graph clearly shows the function value when x = 2.
Notes #2 2. Write and graph a piecewise function for the following situation. A house painter charges $12 per hour for the first 40 hours he works, time and a half for the 10 hours after that, and double time for all hours after that. How much does he earn for a 70-hour week?