Download
1 / 1
10 likes | 137 Vues
Quantitative Analysis of Tumor Cell Responses to Chemotherapy Jeremy Grubin 1 , Salaheldin Hamed 1 and Charles M. Roth 1, 2 1 Department of Biomedical Engineering, 2 Department of Chemical & Biochemical Engineering, Rutgers University, 98 Brett Road, Piscataway, NJ 08854, USA. Abstract.

E N D
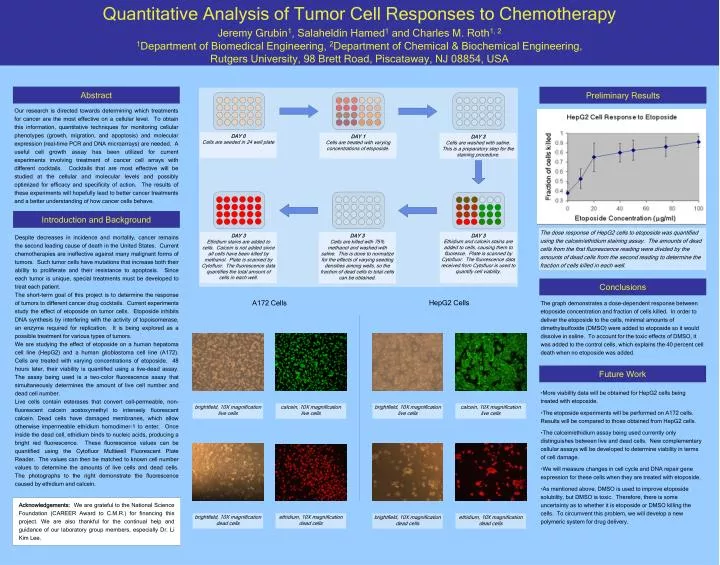
Quantitative Analysis of Tumor Cell Responses to Chemotherapy Jeremy Grubin1, Salaheldin Hamed1 and Charles M. Roth1, 2 1Department of Biomedical Engineering, 2Department of Chemical & Biochemical Engineering, Rutgers University, 98 Brett Road, Piscataway, NJ 08854, USA Abstract Preliminary Results Our research is directed towards determining which treatments for cancer are the most effective on a cellular level. To obtain this information, quantitative techniques for monitoring cellular phenotypes (growth, migration, and apoptosis) and molecular expression (real-time PCR and DNA microarrays) are needed. A useful cell growth assay has been utilized for current experiments involving treatment of cancer cell arrays with different cocktails. Cocktails that are most effective will be studied at the cellular and molecular levels and possibly optimized for efficacy and specificity of action. The results of these experiments will hopefully lead to better cancer treatments and a better understanding of how cancer cells behave. DAY 0 Cells are seeded in 24 well plate DAY 1 Cells are treated with varying concentrations of etoposide. DAY 3 Cells are washed with saline. This is a preparatory step for the staining procedure. Introduction and Background The dose response of HepG2 cells to etoposide was quantified using the calcein/ethidium staining assay. The amounts of dead cells from the first fluorescence reading were divided by the amounts of dead cells from the second reading to determine the fraction of cells killed in each well. DAY 3 Ethidium and calcein stains are added to cells, causing them to fluoresce. Plate is scanned by Cytofluor. The fluorescence data received from Cytofluor is used to quantify cell viability. DAY 3 Ethidium stains are added to cells. Calcein is not added since all cells have been killed by methanol. Plate is scanned by Cytofluor. The fluorescence data quantifies the total amount of cells in each well. DAY 3 Cells are killed with 75% methanol and washed with saline. This is done to normalize for the effects of varying seeding densities among wells, so the fraction of dead cells to total cells can be obtained. Despite decreases in incidence and mortality, cancer remains the second leading cause of death in the United States. Current chemotherapies are ineffective against many malignant forms of tumors. Such tumor cells have mutations that increase both their ability to proliferate and their resistance to apoptosis. Since each tumor is unique, special treatments must be developed to treat each patient. The short-term goal of this project is to determine the response of tumors to different cancer drug cocktails. Current experiments study the effect of etoposide on tumor cells. Etoposide inhibits DNA synthesis by interfering with the activity of topoisomerase, an enzyme required for replication. It is being explored as a possible treatment for various types of tumors. We are studying the effect of etoposide on a human hepatoma cell line (HepG2) and a human glioblastoma cell line (A172). Cells are treated with varying concentrations of etoposide. 48 hours later, their viability is quantified using a live-dead assay. The assay being used is a two-color fluorescence assay that simultaneously determines the amount of live cell number and dead cell number. Live cells contain esterases that convert cell-permeable, non-fluorescent calcein acetoxymethyl to intensely fluorescent calcein. Dead cells have damaged membranes, which allow otherwise impermeable ethidium homodimer-1 to enter. Once inside the dead cell, ethidium binds to nucleic acids, producing a bright red fluorescence. These fluorescence values can be quantified using the Cytofluor Multiwell Fluorescent Plate Reader. The values can then be matched to known cell number values to determine the amounts of live cells and dead cells. The photographs to the right demonstrate the fluorescence caused by ethidium and calcein. Conclusions HepG2 Cells A172 Cells The graph demonstrates a dose-dependent response between etoposide concentration and fraction of cells killed. In order to deliver the etoposide to the cells, minimal amounts of dimethylsulfoxide (DMSO) were added to etoposide so it would dissolve in saline. To account for the toxic effects of DMSO, it was added to the control cells, which explains the 40 percent cell death when no etoposide was added. Future Work • More viability data will be obtained for HepG2 cells being treated with etoposide. • The etoposide experiments will be performed on A172 cells. Results will be compared to those obtained from HepG2 cells. • The calcein/ethidium assay being used currently only distinguishes between live and dead cells. New complementary cellular assays will be developed to determine viability in terms of cell damage. • We will measure changes in cell cycle and DNA repair gene expression for these cells when they are treated with etoposide. • As mentioned above, DMSO is used to improve etoposide solubility, but DMSO is toxic. Therefore, there is some uncertainty as to whether it is etoposide or DMSO killing the cells. To circumvent this problem, we will develop a new polymeric system for drug delivery. brightfield, 10X magnification live cells calcein, 10X magnification live cells brightfield, 10X magnification live cells calcein, 10X magnification live cells Acknowledgements: We are grateful to the National Science Foundation (CAREER Award to C.M.R.) for financing this project. We are also thankful for the continual help and guidance of our laboratory group members, especially Dr. Li Kim Lee. brightfield, 10X magnification dead cells ethidium, 10X magnification dead cells brightfield, 10X magnification dead cells ethidium, 10X magnification dead cells