Download
1 / 60
600 likes | 749 Vues
The Mathematics of the Great U.S. Blackout August 14, 2003. Ralph Fehr, P.E. Engineering Consultant. The Mathematics of the Great U.S. Blackout August 14, 2003.

E N D
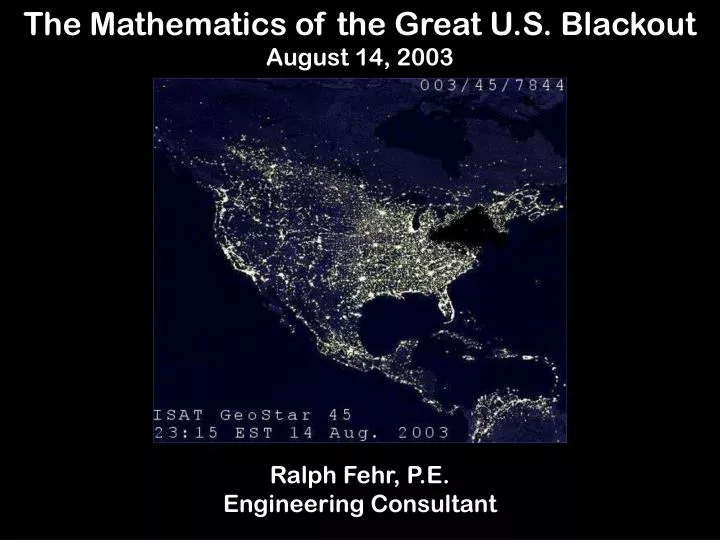
The Mathematics of the Great U.S. Blackout August 14, 2003 Ralph Fehr, P.E. Engineering Consultant
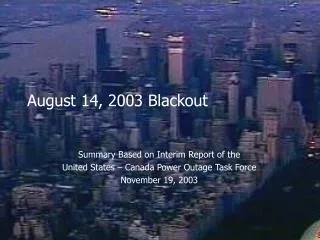
The Mathematics of the Great U.S. Blackout August 14, 2003 Note: The photograph on the preceding slide has been circulating on the Internet since shortly after August 14, 2003. It is impressive, dramatic, and FAKE. But it does attempt to indicate the huge impact and expanse of the August 14 event, and most importantly, it makes for a cool title slide! Ralph Fehr, P.E. Engineering Consultant
North American Electric Reliability Council (NERC) NERC is a not-for-profit company formed after the 1965 Northeast Blackout to promote the reliability of the bulk electrical system that serves North America.
North American Electric Reliability Council (NERC) NERC is divided into 10 regional reliability councils. Each council monitors utilities within its geographic area.
The August 14, 2003 Blackout was caused by a cascading series of events. What started the ball rolling?
The amount of sag is a function of tension. Tension is a function of wire temperature and weight. Temperature is a function of several variables – but a major contributor is electrical loading. Temperature increases with electrical loading SQUARED. As the wire temperature INCREASES, the tension DECREASES. For a level span, the maximum sag D is the y-coordinate at the midpoint of the line, and is given by: where S = span length TH = horizontal component of tension w = conductor weight per unit length
y y = cosh(x) x Mathematical Analysis of Root Cause Alternate Mathematical Analysis of Root Cause Cost maintenance > 0
ONTARIO ONTARIO East Lake 5 Trip: 1:31:34 PM 2 1
MISO State Estimator andReliability Analysis • MISO state estimator and contingency analysis ineffective from 12:37 to 16:04 • State estimator not solving due to missing information on lines out in Cinergy then DPL • Human error in not resetting SE automatic trigger • Using Flowgate Monitoring tool to monitor conditions on previously identified critical flowgates
FirstEnergy Computer Failures • 14:14 Alarm logger fails and operators are not aware • No further alarms to FE operators • 14:20 Several remote consoles fail • 14:41 EMS server hosting alarm processor and other functions fails to backup • 14:54 Backup server fails • EMS continues to function but with very degraded performance (59 second refresh) • FE system data passed normally to others: MISO and AEP • AGC function degraded and strip charts flat-lined • 15:08 IT warm reboot of EMS appears to work but alarm process not tested and still in failed condition • No contingency analysis of events during the day including loss of East Lake 5 and subsequent line trips
Phone Calls to FirstEnergy • FE received calls from MISO, AEP, and PJM indicating problems on the FE system but did not recognize evolving emergency • 14:32 AEP calls regarding trip and reclose of Star-S. Canton • 15:19 AEP calls again confirming Star-S. Canton trip and reclose • 15:35 Calls received about “spikes” seen on system • 15:36 MISO calls FE regarding contingency overload on Star-Juniper for loss of Hanna-Juniper • 15:45 FE tree trimming crew calls in regarding Hanna-Juniper flashover to a tree • PJM called MISO at 15:48 and FE at 15:56 regarding overloads on FE system
The Chamberlin - Harding 345 kV line sags into a tree at 3:05:41. Contact with tree causes a ground fault which results in very high current. The protective relays on the Chamberlin – Harding line sense the high current and trip (de-energize) the line. A Digital Fault Recorder (DFR) at nearby Juniper Substation recorded the fault current.
Chamberlin-Harding Indication of Ground Fault Due to Tree Contact as Measured by DFR at Juniper y = ex sin x NOT STABLE should be y = e-x sin x
Hanna-Juniper (3:32:03) (3:05:41)
Hanna Juniper Confirmed as Tree Contact atLess than Emergency Ratings of Line
(3:05:41) (3:32:03) Star- S. Canton (3:41:35)
ONTARIO Situation after Initial Trips 3:05:41 – 3:41:35
Canton Central – Tidd (3:45:41)
20% 20% 20% 20% 20% Anatomy of a Cascading Outage Source Load
0% 25% 25% 25% 25% Anatomy of a Cascading Outage Source Load
0% 0% 33% 33% 33% Anatomy of a Cascading Outage Source Load
0% 0% 0% 50% 50% Anatomy of a Cascading Outage Source Load
0% 0% 0% 0% 100% Anatomy of a Cascading Outage Source Load
138 kV Cascade Contributes Furtherto Overload of Sammis-Star 15:51:41 EDT 15:05:41 EDT 16:05:55 EDT 15:32:03 EDT 15:41:35 EDT
Sammis-Star (4:05:57.5)
Sammis-Star Zone 3 Relay Operateson Steady State Overload Operating point must lie below blue curve, or line will trip. As loading on line increases, operating point moves up and to the left.
Remaining Paths Major Path to Cleveland Blocked after Loss of Sammis-Star 4:05:57.5 PM
ONTARIO 345 kV Lines Trip Across Ohio to West
ONTARIO Generation Trips 4:09:08 – 4:10:27 PM
345 kV Transmission Cascade Moves North into Michigan 4:10:36 – 4:10:37 PM
Northern Ohio and Eastern Michigan Served Only from Ontario after 4:10:37.5 – 4:10:38.6 PM
Eastern Eastern Michigan (Detroit) UnstableVoltage and Frequency Collapse and Pole Slipping Ontario – Michigan Interface Flow and Voltages Beginning 16:10:38