Download

1 / 32
320 likes | 477 Vues
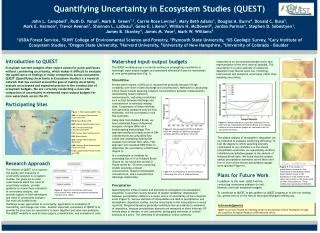
Quantifying uncertainty in the UK carbon flux. Tony O’Hagan CTCD, Sheffield. Outline. Introduction Gaussian process emulation The England and Wales carbon flux 2000. Computer models.

E N D
Quantifying uncertainty in the UK carbon flux Tony O’Hagan CTCD, Sheffield RSS Kent Local Group
Outline • Introduction • Gaussian process emulation • The England and Wales carbon flux 2000 RSS Kent Local Group
Computer models • In almost all fields of science, technology, industry and policy making, people use mechanistic models to describe complex real-world processes • For understanding, prediction, control • There is a growing realisation of the importance of uncertainty in model predictions • Can we trust them? • Without any quantification of output uncertainty, it’s easy to dismiss them RSS Kent Local Group
Examples • Climate prediction • Molecular dynamics • Nuclear waste disposal • Oil fields • Engineering design • Hydrology RSS Kent Local Group
Uncertainty analysis • Consider just one source of uncertainty • We have a computer model that produces output y = f(x) when given input x • But for a particular application we do not know x precisely • So X is a random variable, and so therefore is Y = f(X) • We are interested in the uncertainty distribution of Y • How can we compute it? RSS Kent Local Group
Monte Carlo • The usual approach is Monte Carlo • Sample values of x from its distribution • Run the model for all these values to produce sample values yi = f (xi) • These are a sample from the uncertainty distribution of Y • Neat but impractical if it takes minutes or hours to run the model • We can then only make a small number of runs RSS Kent Local Group
GP solution • Treat f(.) as an unknown function with Gaussian process (GP) prior distribution • Use available runs as observations without error, to derive posterior distribution (also GP) • Make inference about the uncertainty distribution • E.g. The mean of Y is the integral of f(x) with respect to the distribution of X • Its posterior distribution is normal conditional on GP parameters RSS Kent Local Group
Gaussian process emulation • Principles of emulation • The GP and how it works RSS Kent Local Group
Emulation • A computer model encodes a function, that takes inputs and produces outputs • An emulator is a statistical approximation of that function • Estimates what outputs would be obtained from given inputs • With statistical measure of estimation error • Given enough training data, estimation error variance can be made small RSS Kent Local Group
So what? • A good emulator • estimates the model output accurately • with small uncertainty • and runs “instantly” • So we can do uncertainty analysis etc fast and efficiently • Conceptually, we • use model runs to learn about the function • then derive any desired properties of the model RSS Kent Local Group
Gaussian process • Simple regression models can be thought of as emulators • But error estimates are invalid • We use Gaussian process emulation • Nonparametric, so can fit any function • Error measures can be validated • Analytically tractable, so can often do uncertainty analysis etc analytically • Highly efficient when many inputs • Reproduces training data correctly RSS Kent Local Group
2 code runs • Consider one input and one output • Emulator estimate interpolates data • Emulator uncertainty grows between data points RSS Kent Local Group
3 code runs • Adding another point changes estimate and reduces uncertainty RSS Kent Local Group
5 code runs • And so on RSS Kent Local Group
BACCO • This has led to a wide ranging body of tools for inference about all kinds of uncertainties in computer models • All based on building the GP emulator of the model from a set of training runs • This area is now known as BACCO • Bayesian Analysis of Computer Code Output RSS Kent Local Group
BACCO includes • Uncertainty analysis • Sensitivity analysis • Calibration • Data assimilation • Model validation • Optimisation • Etc… • All within a single coherent framework RSS Kent Local Group
MUCM • Managing Uncertainty in Complex Models • Large 4-year research grant • Started in June 2006 • 7 postdoctoral research assistants • 4 PhD studentships • Based in Sheffield, Durham, Aston, Southampton, LSE • Objective: to develop BACCO methods into a robust technology that is widely applicable across the spectrum of modelling applications RSS Kent Local Group
Example: UK carbon flux in 2000 • Vegetation model predicts carbon exchange from each of 707 pixels over England & Wales • Principal output is Net Biosphere Production • Accounting for uncertainty in inputs • Soil properties • Properties of different types of vegetation • Aggregated to England & Wales total • Allowing for correlations • Estimate 7.55 Mt C • Std deviation 0.56 Mt C • Analysis by Marc Kennedy and John Paul Gosling RSS Kent Local Group
SDGVMd outputs for 2000 RSS Kent Local Group
Outline of analysis • Build emulators for each PFT at a sample of sites • Identify most important inputs • Define distributions to describe uncertainty in important inputs • Analysis of soils data • Elicitation of uncertainty in PFT parameters • Need to consider correlations RSS Kent Local Group
Carry out uncertainty analysis in each sampled site • Interpolate across all sites • Mean corrections and standard deviations • Aggregate across sites and PFTs • Allowing for correlations RSS Kent Local Group
Sensitivity analysis for one pixel/PFT RSS Kent Local Group
Elicitation • Beliefs of expert (developer of SDGVMd) regarding plausible values of PFT parameters • Important to allow for uncertainty about mix of species in a pixel and role of parameter in the model • In the case of leaf life span for evergreens, this was more complex RSS Kent Local Group
EvNl leaf life span RSS Kent Local Group
Correlations • PFT parameter in one pixel may differ from in another • Because of variation in species mix • Common uncertainty about average over all species induces correlation • Elicit beliefs about average over whole UK • EvNl joint distributions are mixtures of 25 components, with correlation both between and within years RSS Kent Local Group
Mean NBP corrections RSS Kent Local Group
NBP standard deviations RSS Kent Local Group
Land cover (from LCM2000) RSS Kent Local Group
Aggregate across 4 PFTs RSS Kent Local Group
Sensitivity analysis • Map shows proportion of overall uncertainty in each pixel that is due to uncertainty in the parameters of PFTs • As opposed to soil parameters • Contribution of PFT uncertainty largest in grasslands/moorlands RSS Kent Local Group
England & Wales aggregate RSS Kent Local Group
Conclusions • Bayesian methods offer a powerful basis for computation of uncertainties in model predictions • Analysis of E&W aggregate NBP in 2000 • Good case study for uncertainty and sensitivity analyses • But needs to take account of more sources of uncertainty • Involved several technical extensions • Has important implications for our understanding of C fluxes • Policy implications RSS Kent Local Group