Download
1 / 3
30 likes | 157 Vues
Spectrograph Fundamentals. The Bortle Dark-Sky Scale. Modeling of Light Pollution in Suburban Areas Using Remotely Sensed Imagery and GIS Chalkias et. al, 2006. Purpose. http://www.sbig. com/sbwhtmls/online .htm.

E N D
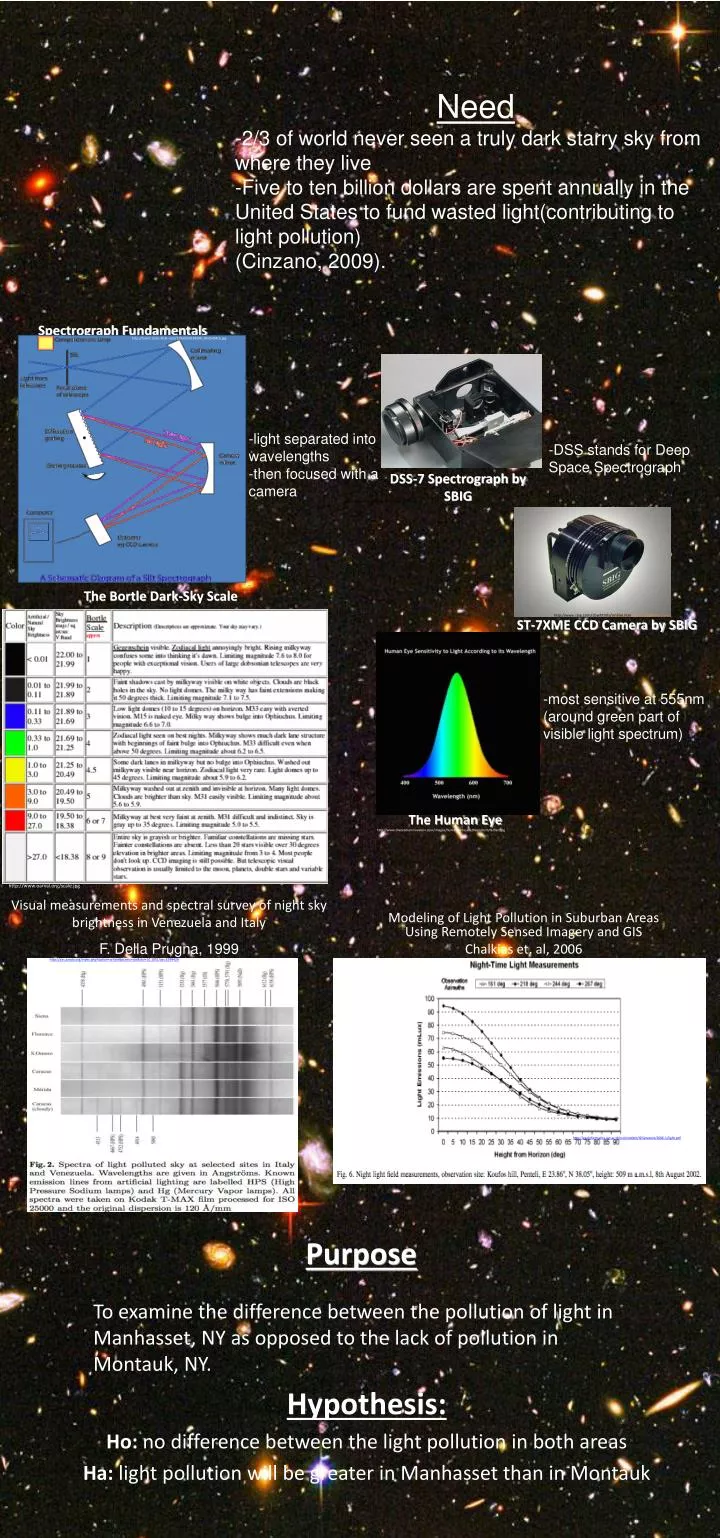
Spectrograph Fundamentals The Bortle Dark-Sky Scale Modeling of Light Pollution in Suburban Areas Using Remotely Sensed Imagery and GIS Chalkias et. al, 2006 Purpose http://www.sbig.com/sbwhtmls/online.htm Visual measurements and spectral survey of night sky brightness in Venezuela and Italy F. Della Prugna, 1999 F. Della Prugna, 1999 Need -2/3 of world never seen a truly dark starry sky from where they live -Five to ten billion dollars are spent annually in the United States to fund wasted light(contributing to light pollution) (Cinzano, 2009). To examine the difference between the pollution of light in Manhasset, NY as opposed to the lack of pollution in Montauk, NY. http://aas.aanda.org/index.php?option=article&access=doi&doi=10.1051/aas:1999426 ST-7XME CCD Camera by SBIG http://www.sbig.com/sbwhtmls/online.htm DSS-7 Spectrograph by SBIG http://farm2.static.flickr.com/1293/554194288_965f5494cb.jpg http://geoinformatics.sut.ac.th/sut/student/GISpresent/2006-1/light.pdf http://www.oarval.org/scale.jpg The Human Eye http://www.theoremeinnovation.com/images/human%20eye%20sensitivity%20en.jpg -light separated into wavelengths -then focused with a camera -DSS stands for Deep Space Spectrograph -most sensitive at 555nm (around green part of visible light spectrum) Hypothesis: Ho: no difference between the light pollution in both areas Ha: light pollution will be greater in Manhasset than in Montauk
Methodology Light Pollution Measured by the DSS-7 Control: sky measured by DSS-7 in Montauk, NY Variable: sky measured DSS-7 in Manhasset, NY Procedure Spectrograph attached to the CCD imager, many images taken to examine types of light pollutants, images processed using CCDops, graphed using Excel, and overlapped using Adobe Photoshop. Measurement Image and graph Montauk spectra, image and graph Manhasset. Analysis Graph/map of data collected Amounts vs. types of light pollution analyzed Manhasset Zenith Overlapped with Manhasset Zenith with Light Pollution Filter Manhasset Zenith Overlapped with Metal Halide, Fluorescent, and Low Pressure Sodium Metal Halide Fluorescent Low Pressure Sodium Zenith Montauk Zenith Overlapped with Montauk Zenith with Light Pollution Filter Manhasset Zenith Overlapped with Montauk Zenith
Bibliography Conclusion Discussion Future Studies • Chalkias, C., M. Petrakis, B. Psiloglou, and M. Lianou. "Modelling of light pollution in suburban areas using remotely sensed imagery and GIS." Journal of Environmental Management 76 (2004)): 57-63. Elesiver. Department of Geography, Harokopio University, 19 Sept. 2005. Web. http://geoinformatics.sut.ac.th/sut/student/GISpresent/2006-1/light.pdf • Cinzano. "Light Pollution Information by Starry Night Lights." Night Sky Friendly Outdoor Lighting. N.p., 2009. Web. http://www.starrynightlights.com/lpIndex.html • Cole, Gary M. "A Pellicle Autoguider for the DSS-7 Spectrograph." Pellicle Autoguider (2006): 153-56. Pellicle Autoguider. Starphysics Observatory, 2007. Web. http://articles.adsabs.harvard.edu/cgi-bin/nph-iarticle_query?2007SASS...26..153C&data_type=PDF_HIGH&whole_paper=YES&type=PRINTER&filetype=.pdf • Holmes, Alan. "DSS-7 Deep Space Spectrograph." SBIG Santa Barbara Instrument Group. N.p., 20 Mar. 2002. Web. http://www.sbig.com/dss7/dss7.htm • Kaler, James. "Obtaining Astronomical Spectra- Spectrographs." Australia Telescope Outreach and Education. CSIRO Australia, 23 June 2004. Web. http://outreach.atnf.csiro.au/education/senior/astrophysics/spectrographs.html • Kulesa, Craig. "What is Spectroscopy?" What is Spectroscopy? N.p., 4 Feb. 1997. Web. http://loke.as.arizona.edu/~ckulesa/camp/spectroscopy_intro.html • La Pointe, Robert. "Measuring the Hubble Constant Using SBIG's DSS-7." NASA Astrophysics Data System (2008): 137-40. Society for Astronomical Sciences Inc., 2008. Web. http://articles.adsabs.harvard.edu/cgi-bin/nph-iarticle_query?2008SASS...27..137L&data_type=PDF_HIGH&whole_paper=YES&type=PRINTER&filetype=.pdf • Licker, Mark D. “Dictionary of Astronomy” page 101; 2003 • Plavec, Mirek J.; “Stellar Evolution” McGraw-Hill,1997, pp 392-401. • Prugna, F. Della. "Visual measurements and spectral survey of night sky brightness in Venezuela and Italy." The European Southern Observatory (n.d.): n. pag. Astronomy and Astrophysics. Centro de Investigaciones de Astronom� CIDA, 9 Sept. 1999. Web. http://aas.aanda.org/index.php?option=article&access=doi&doi=10.1051/aas:1999426 • Puech, Michael, H. Flores, Michael Lehnert, B. Neichel, T. Fusco, P. Rosati, J.-G. Cuby, and Gary Rousset. "Coupling MOAO with Integral Field Spectroscopy: specifications for the VLT and the E-ELT." Observatoire de Paris (n.d.): n. pag. LESIA. Laboratoire d但strophysique de Marseille, 8 Aug. 2008. Web. http://arxiv.org/pdf/0808.1196v1 • Reviglio, Pietro M., and David J. Helfand. "Active Galaxies in the Sloan Digital Sky Survey I: The Spectroscopically Unremarkable Population of the Local Universe." (2008): n. pag. Astronomy Department. Astronomy Department, Columbia University, 2008. Web. http://arxiv.org/pdf/0902.1766v1 • Richmond, Michael. "Spectrographs and Spectra." Spectrographs and Spectra. N.p., n.d. Web. http://spiff.rit.edu/classes/phys301/lectures/spectra/spectra.html • Rosoni, Stefano. "Proposal of a spectroscopic map of astronomical sites." Memorie della Societa Astronomia Italianap.235 71 (1997): 235-38. Circolo Astronomico Dorico. Paolo Andrenelli, 1997. Web. http://articles.adsabs.harvard.edu/full/2000MmSAI..71..235R • Smith, Gene. "Stellar Spectra." Center for Astrophysics & Space Sciences, UCSD. N.p., 16 Apr. 1999. Web. <http://cass.ucsd.edu/public/tutorial/Stars.html>. -Light pollution filter decreases the intensity of different areas of spectra (especially around 1000nm area) -Montauk’s spectra has an overall less intensity than Manhasset’s spectra -Montauk has less light pollution than Manhasset -Manhasset has higher intensity of light at around 1000-1200 nm region -Manhasset because it is a suburban area has more light pollution due to all of the houses, and street lighting -On a Bortle Dark-Sky Scale, it even shows Montauk has less light pollution than Manhasset -So far, only used the zeniths of each area -Have yet to image all of the different types commercial outdoor lights due to unavailability at the moment -Missing lights include: Halogen, Mercury-Vapor, and High Pressure Sodium • -Data collected as of now supports Alternate Hypothesis • Manhasset Zenith overlapped with Montauk Zenith shows that the Manhasset night sky is brighter than Montauk • -Manhasset night sky shows more intensity than Montauk • (especially in the 1000-1200 nm region) • -Light pollution filter used on spectrograph decreased intensity at around 1000 nm • -Project can be branched out in many different directions. • -The eye can be studied in greater detail to determine how and why it is so sensitive to the 555nm spectra. • -More lights can be imaged to get the best possible spectra that can be filtered out the easiest. • -The prices of lights need to be analyzed as well, needs to be economical