Download
1 / 21
210 likes | 666 Vues
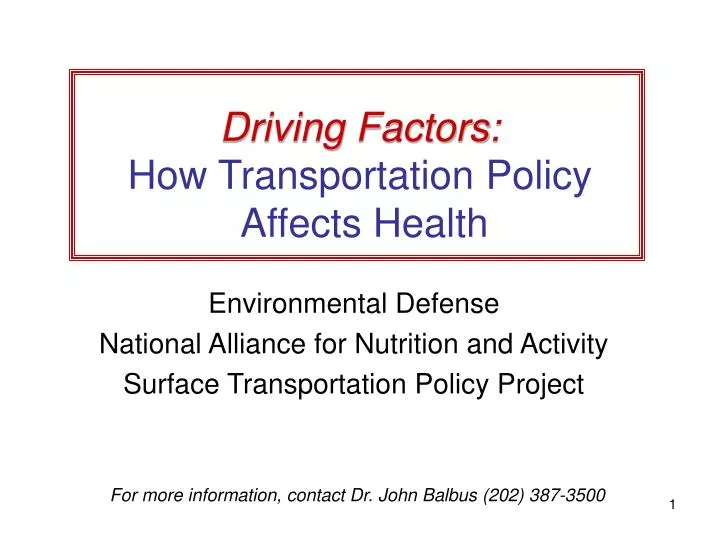
Driving Factors: How Transportation Policy Affects Health Environmental Defense National Alliance for Nutrition and Activity Surface Transportation Policy Project For more information, contact Dr. John Balbus (202) 387-3500 Summary

E N D
Driving Factors:How Transportation Policy Affects Health Environmental Defense National Alliance for Nutrition and Activity Surface Transportation Policy Project For more information, contact Dr. John Balbus (202) 387-3500
Summary • Federal transportation policy offers great potential for enhancing the nation’s health • Transportation policy decisions will affect the severity of two epidemics in the U.S., asthma and obesity • The many thousands of deaths each year from transportation-related crashes demand more effective safety measures • Transportation and community design also affect health through toxic air pollution, impaired water quality, noise, and access to healthy food
Asthma rates up 75% from 1980 to 19941 Children affected most 160% increasein asthma prevalence for children under 4 years old between 1980 and 1995 up from 2.3 million in 1980 to 5.5 million in 19952 Asthma is the number one cause of hospitalization among children under the age of 153 Unequal burdens Rates in blacks 21% higher than whites The annual costs of asthma: 5500 deaths 1.5 million ER visits Estimated $12 billion dollars in 2000 $8.1 billion direct costs 3 million lost adult workdays 10.1 million lost schooldays What’s driving the asthma epidemic? Asthma Prevalence in Children and Young Adults: 1980-94
Transportation affects asthma by worsening air quality Transportation sources emit over one-third of the chemicals that form ozone VOC emissions from transportation, 1997 NOx emissions from transportation, 1997 • Motor vehicles release 31% of volatile organic compounds (VOCs) • VOCs and Nitrogen oxides (NOx) combine to form ozone in the atmosphere • National emissions of NOx have increased 9 %over the past 20 years. This increase is directly related to increased driving
The lesson of Atlanta’s summer Olympics5 A 22.5% drop in morning traffic volume due to improved traffic management was associated with: Greater than 40% reduction in acute care visits for asthma A 28% drop in peak ozone An 11.1% reduction in pediatric ER visits for asthma A 19.1% reduction in hospitalization for asthma Living within 200 meters of a major road has been linked with asthma,cough, and airway irritation Substantial research links ozone and particulate air pollution with worsened symptoms and increased hospitalization for asthma A recent study for the first time documented children exercising in high ozone areas are at higher risk of becoming asthmatics4 Medical research links asthma to transportation
Multiple Air Toxics Exposure Study (MATES-II)6 Landmark urban air quality study done by Southern California Air Quality Management District Total added risk 1.4 per thousand 90% of added cancer risk from transportation sources 70% diesel particulates 20% other air toxics American Cancer Society study of mortality associated with fine particulates (PM2.5) 10 mcg/m3 increase in PM2.5 associated with 8% increase in lung cancer mortality7 Denver study found children living near roads with highest traffic density had eight-fold higher leukemia risk8 Subsequent study in California did not find increased risk Toxic traffic: carcinogenic effects of air emissions
64% of the U.S. population is overweight9(BMI over 25 kg/m2) Over 30% are obese, with higher rates among black and Mexican-American women10 Obesity rates doubled between 1980 and 2000 Obesity increases the risk of diabetes, heart disease, cancer and other serious medical conditions TEA-3: opportunity to support physical activity 75% of Americans age 18 and older get too little physical activity11 • Rising obesity rates are related to 61% increase in diabetes since 199012
1991 1995 No Data <10% 10%-14% 15-19% >20% Obesity Trends* Among U.S. Adults BRFSS, 1991, 1995 and 200013 (*BMI 30, or ~ 30 lbs overweight for 5’4” woman) 2000
Health Impacts of Physical Inactivity14 Increased risk of obesity Increased risk of major diseases Diabetes Heart disease and stroke Colon cancer Increased symptoms of depression, anxiety Poorer development and maintenance of skeletal and muscle tissue Inactivity and poor diet second leading cause of preventable death in the U.S Leading to one-third of all premature deaths The Costs of Physical Inactivity15 Increasing physical activity among inactive Americans over the age of 15 could reduce annual national medical costs by $77 billion Estimated 5.5-7% of nation’s total health costs related to obesity 17% of total cost of CVD attributable to overweight and obesity Impacts of physical inactivity
The built environment directly affects whether people walk or bike16 Transportation policies and design influence choices N. Europe: >40% of trips by foot or bike, <40% by private auto US: 86% of trips by private auto, <5% by foot Current transportation policy discourages physical activity Less than 1% of federal transportation funds go to pedestrian facilities or safety Anyone for a stroll?
Fewer people are walking • Fewer people are walking to work: • 1990 Census: 3.9% • 2000 Census: 2.9% • 75% of children don’t bike or walk to school17 How children get to school Barriers to Walking Source: U.S. Dept. of Transportation, 1995 Nationwide Personal Transportation Survey
Among children, walking trips have dropped by 37%18 Impacts on children Children are walking less, gaining weight, and suffering related illness as a result • One in three children in the US is overweight • Over the last two decades, rates of overweight have doubled in children and tripled in adolescents. • Children’s hospital discharge rate for diabetes has doubled19 • From 1979 to 1999, annual hospital costs for treating obesity-related diseases in children rose three-fold ($35 million to $127 million)19 • One-fourth of children 5 to 10 years old have high cholesterol, high blood pressure, or other early warning signs of heart disease20 Childhood Obesity* • *Obese is defined by the 95th percentile of the sex-specific CDC BMI-for-age-growth charts. • **Data for 1966-70 are for adolescents ages 12-17.
Between 1990 and 1997, there was a 14% increase in the number of motor vehicle traffic-related fatalities among older adults – defined as adults 65 years and older Motor vehicle crashes are the leading cause of deaths due to injury21 About 13 % of traffic fatalities are pedestrians or cyclists even though less than 6% of all trips are made by foot or bicycle22 Motor vehicle related fatalities remain a major public health problem
Child pedestrians: how well are we protecting them? Pedestrian injury remains the 2nd leading cause of injury-related death among children ages 5-14 • In 1998, children less than 15 years old accounted for • 30% of all nonfatal pedestrian injuries • 11% of all pedestrian fatalities22 • 60 percent of parents and children encounter at least one serious hazard along their routes to school22 • Common hazards included the lack of a sidewalk or crosswalk, wide roads, complicated traffic conditions, improper parking and speeding drivers
Economic impact of motor vehicle crashes More than $230.6 billion each year spent in the United States according to NHTSA (2000)23 • $61 billion in lost workplace productivity • $20.2 billion in lost household productivity • $59 billion in property damage • $32.6 billion in medical costs • $25.6 billion in travel delay costs • Cost for average roadway fatality: $977,000 • Cost for critically injured crash survivor: $1.1 million • Overall, nearly 75 percent of the costs of roadway crashes are paid by those not directly involved. In 2000 these costs totaled $170 billion • This occurred as federal transportation funding reached a record level of $33 billion in one year
Additional health impacts of transportation policy • Noise • Linked to deterioration of children’s mental health24 • Water quality and quantity • Paving increases pollutant runoff, impeded groundwater recharge • 4% runoff on grassland vs 15% in suburbs25 • Mental Health • Isolation of private motor vehicle use • Decline in social capital • Road rage a growing problem
US Dept. of Health and Human Services’ Healthy People 201026 Reduce proportion of adults, adolescents and children who are obese “Improve health, fitness, and quality of life through daily physical activity.” “The major barriers most people face when trying to increase physical activity are lack of time, lack of access to convenient facilities, and lack of safe environments in which to be active” (emphasis added) “Increase use of alternative modes of transportation to reduce motor vehicle emissions and improve the Nation's air quality.” US Dept. of Transportation’s Transportation Equity Act for the 21st Century Provides more funds for states that spend more on roads and have more vehicle miles traveled (VMTs) Insufficient transit funds to level playing field with roadbuilding Lack of accountability for how spending affects communities and their health In the last two years, the portion of federal spending on new roads grew 21% while spending on other transportation modes fell by 19% Contradictory federal goals Shouldn’t our transportation policies do a better job of supporting our health agenda?
Sustain and expand successful programs Congestion Mitigation and Air Quality Programs (CMAQ) Enchancements Recreational Trails Increase transit funding Dedicate funding for Safe Routes to School Programs Require routine accommodation of pedestrians and bicyclists Also benefits disabled and infirm seniors Improve accountability through better data collection, analysis models and use of health-based performance standards Collect better data on pedestrians and bicyclists of all ages Ensure everyone has transportation choices Provide equal employee benefits to transit riders, pedestrians, cyclists Require Health Impact Evaluations as part of planning process Support better collection of health data related to transportation hazards $100 million to CDC to support health tracking system Make transportation policy work for our communities and our health
References cited • Mannino, David M., et al. 1998 April 24. Surveillance for Asthma -United States, 1960-1995. CDC MMWR. 47 (SS-1): 1-28. • U.S. Dept. of Health and Human Services and National Heart, Lung and Blood Institute. 1999. Data Fact Sheet: Asthma Statistics. [online]. Available from: http://www.nhlbi.nih.gov/health/prof/lung/asthma/asthstat.pdf. Accessed 2003 Feb 03 • American Lung Association. 2002. Pediatric Asthma: A Growing Health Threat. [online]. Available from: http://www.lungusa.org/asthma/merck_pediatric.html. Accessed 2003 Feb 03 • McConnell, R., et al. 2002. Asthma in exercising children exposed to ozone: a cohort study. Lancet 359 (9304): 386-91. • Friedman, MS., Et al. 2001. Impact of changes in transportation and commuting behaviors during the 1996 Summer Olympic Games in Atlanta on air quality and childhood asthma. JAMA 285 (7): 897-905. • Air Quality Management District. 2002. Multiple Air Toxics Exposure Study (MATES II). [online] Available from: http://www.aqmd.gov/matesiidf/matestoc.htm. Accessed 2003 Feb 03. • Pope et al. 2002. Lung Cancer, Cardiopulmonary Mortality and Long-term Exposure to Fine Particulate Air Pollution. JAMA 287(9):1132-1141. • Pearson, R.L. 2000. Distance-weighted traffic density in proximity to a home is a risk factor for leukemia and other childhood cancers. Journal of Air Waste Manag. Assoc. 50(2): 175-80. • CDC, National Center for Health Statistics. 2002. Prevalence of Overweight and Obesity Among Adults:United States, 1999-2000. [online] Available from: http://www.cdc.gov/nchs/products/pubs/pubd/hestats/obese/obse99.htm. Accessed 2003 Feb 03. • Flegal, K., et al. 2002. Prevalence and Trends in Obesity Among US Adults, 1999-2000. JAMA 288 (14): 1723-1727
References cited 11. American Heart Association. 2002. Heart and Stroke Statistical Update. Dalles, Texas: American Heart Association; 2001 12. Mokdad, Ali H., et al. 2003. Prevalence of obesity, diabetes, and obesity-related health risk factors, 2001. JAMA 289 (1): 76-79. • Mokdad, Ali H., et al. 1999. The Spread of the Obesity Epidemic in the United States, 1991-1998. JAMA 282 (16): 1519-1522. • Centers for Disease Control and Prevention. 1999. A Report of the Surgeon General Physical Activity and Health: The link between physical activity and morbidity and mortality. [online] Available from: http://www.cdc.gov/nccdphp/sgr/pdf/mm.pdf. Accessed 2003 Feb 03. • Pratt, M., et al. 2000. Higher direct medical costs associated with physical inactivity. The Physician and Sports Medicine 28(10). • Ewing, R., and R. Cervero. 2001. Travel and the Built Environment: A Synthesis. Transportation Research Record 1780: 87-114. • Dellinger, AM., et al. 2002 Aug 16. Barriers to Children Walking and Biking to School --- United States, 1999. CDC MMWR. 51(32): 701-704 • Alliance for a New Transportation Charter. 2003.Transportation and Health. [online] Available from: http://www.antc.net/issues/Transportation%20and%20Health.pdf. Accessed 2003 Feb 03. • Wang G, Dietz WH. 2002. Economic burden of obesity in youths aged 6 to 17 years: 1979-1999. Pediatrics 109(6): 1195. • Freedman DS., et al. The relation of overweight to cardiovascular risk factors among children and adolescents: The Bogalusa Heart Study. Pediatrics 1999; 103: 1175-1182.
References cited • CDC National Center for Health Statistics (NCHS). 1998. National Mortality Data, 1997. Hyattsville (MD): NCHS. [online] Available from: http://www.cdc.gov/ncipc/duip/duip.htm. Accessed 2003 Feb 03 • National Safe Kids Campaign. 2002. Research: Report to the Nation on Child Pedestrian Safety. [online] Available from: http://www.safekids.org/tier3_cd.cfm?content_item_id=7571&folder_id=680. Accessed 2003 Feb 03. • National Highway Traffic Safety Administration. 2002. The Economic Impact of Vehicle Crashes 2000. [online]Available from: http://www.nhtsa.dot.gov/people/economic/EconImpact2000/index.htm. Accessed 2003 Feb 03. • Lercher, P., et al. 2002. Ambient neighbourhood noise and children's mental health. Occup Environ Med 59: 380-6. • Stephenson, D., et at. 1994. Comparison of the water balance for an undeveloped and a suburban catchment. Hydrological Sciences Journal 39:295-307. • U.S. Department of Health and Human Services. 2000. Healthy People 2010: Understanding and Improving Health. 2nd. ed [online] Available from: http://www.healthypeople.gov/Document/pdf/uih/2010uih.pdf. Accessed 2003 Feb 03 • Surface Transportation Policy Project. 2002. Changing Direction: Federal Transportation Spending in 1990's. [online] Available from: http://www.transact.org/. Accessed 2003 Feb 03.