Download
1 / 41
420 likes | 839 Vues
WATER: Clear Gold? Natural Resource: Water Agenda: Water Conservation Lesson Plan Topics: I. Self analysis A. Daily water consumption B. National average per person II. Aral Sea A. Size and reduction B. Socio-economic reasons and impact C. Applicable to Great Lakes

E N D
Natural Resource: Water Agenda: Water Conservation Lesson Plan Topics: I. Self analysis A. Daily water consumption B. National average per person II. Aral Sea A. Size and reduction B. Socio-economic reasons and impact C. Applicable to Great Lakes III. Conservation Treaty Proposal A. Conservation Home Evaluation Website B. Five areas to improve C. Written proposal D. Present the proposals E. Evaluate and reflect on the success of their implementation F. Correlations between this and the UN/Envirnomental Treaties IV. Essay to Legislators
Table 1: Dishwasher water use rates, national average* *Mayer, et. al. 1999
The Aral Sea is located in the countries of Uzbekistan and Kazakhstan.
The Aral Sea was once twice the size of Belgium but has steadily decreased in size.
Aral SeaAbandoned BoatKarakalpakstan, Uzbekistan Uzbekistan was heavily irrigated during Soviet times, to provide water for growing cotton. The excessive water taken from the Amu-Darya river caused the Aral Sea to dry up. This has had devastating consequences for the region of Karakalpakstan. Here, a boat sits in what used to be the Aral Sea.
SHIP GRAVEYARD OF THE ARAL SEA
History of Aral Sea The Aral Sea is located in southwestern Kazakhstan and northwestern Uzbekistan, near the Caspian Sea. See map, on slide above. It was once twice the size of Belgium but has steadily decreased in size. Only a few decades ago, the Aral had: a surface area of 64,000 square kilometers a water volume of 1,020 cubic kilometers an average depth of twenty to twenty-five kilometers. Mineralization of the sea, which was freshwater, was less than 9 grams per liter. Each day, 160 tons of fish were pulled from its waters. In the 1960s, economic officials in Moscow began diverting the waters from the Syr and Amu rivers, which flow into the Aral, for use in cotton farming. Irrigation canals were dug speedily without any type of lining, such as concrete or clay. Due to this, the canals lose up to 40% of the water they carry before it reaches its crop or destination. However, at the time, the large amounts of money from cotton blinded the officials to the definate future results of their actions. They pushed the cotton industry at all costs! Currently, Kazakhstan and Uzbekistan are substituting less water intensive crops such as winter wheat, grains, soybeans, fruits, and vegetables to replace the cotton industry thus reducing some of the need for irrigation.
Recent aerial view of Aral Sea Its sea level is now 40 meters, its surface area 40,000 square meters, and its volume 400 cubic kilometers.
Aral Sea http://visearth.ucsd.edu/VisE_Int/aralsea/framesets/aralnav_fish.html Use this interactive website to click on various locations within the Aral Sea to retrieve a close up view.
Diagram showing inflow and outflow rates for Lake Michigan(source: U.S. Geological Survey Water-Resources Investigations Report 00-4008)
D E C L I N E I N A Q U I F E R Figure 6. Decline in water levels in the sandstone confined aquifer, Chicago and Milwaukee areas, 1864-1980. (Modified from Avery, 1995.)
Figure 4. Estimated ground-water withdrawal rates for some major U.S. metropolitan areas (data not available for Canadian areas).
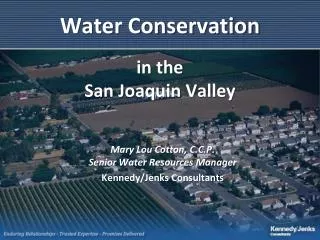
Subcontinental Divide and the Great Lakes Basin The subcontinental divide that crosses the study area is the watershed boundary for the Great Lakes Basin. West of this divide, rivers and the waters that replenish them do not discharge to the Great Lakes but, instead, are tributary to the Mississippi River. The subcontinental divide is very close to Lake Michigan in southeastern Wisconsin. The map shows that more than half the case study area lies west of the divide and, therefore, falls in the Mississippi River Basin.
The Importance of Ground Water in the Great Lakes Region Ground water helps to replenish the lake level water.
Extra Slides • The following slides are extra resources for the teacher.
Figure 5. Generalized ground-water flow (A) under natural conditions and (B) affected by pumping (Note that surface-and ground-water divides are coincident in A but not in B).