Download
1 / 8
80 likes | 140 Vues
Predicting Map-Matching Values using GPS Data from Navigation Software. Visualization of the data set used – spanning over 1300 trips and 2 million records. Overview. Objective : Map-Matching Values, or SnapWeights , are a measure of data point error.

E N D
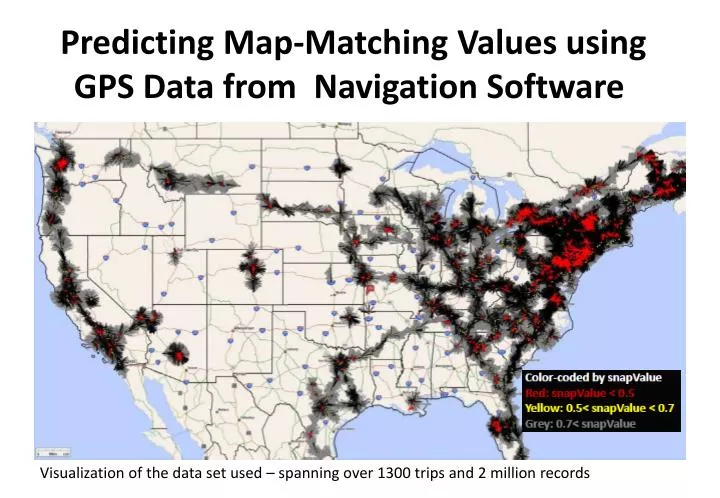
Predicting Map-Matching Values using GPS Data from Navigation Software Visualization of the data set used – spanning over 1300 trips and 2 million records
Overview • Objective: • Map-Matching Values, or SnapWeights, are a measure of data point error. • Our aim is to model and predict this based on variables such as position, velocity, and heading • Approaches: • Linear Regression of logit-transformed response with I.I.D. data assumed • Beta Regression of Independent responses that are Beta-Distributed with different parameters • AR model, treating data as a Time Series. • Illustration of Data:
Time Series Models: AR/MA • These models assume a linear dependence on previous data points and require stationarity and ergodicity • AR(p): • MA(q): where all are White Noise error terms • Different distributions for different trips. Generally appear stationary with no clear trend or seasonality. • Auto-correlations plotted. Generally slow decay indicates low probability of AR/MA process • Similarly, not likely high value in trying combination model ARMA
Linear Regression of Transformed SnapWeight • Response variable transformed using a Logit Function and then linearly regressed on covariates such as speed, bearing, and acceleration where • To uphold I.I.D assumption, trips with similar distributions are to be combined • Similarity of distributions determined empirically using either Kolmogorov-Smirnov test or Mutual Information function (less rigorous but so far less implementation problems) • Not many covariates. Just a matter of training and then validating an assortment of covariate combinations using OLS and regularized methods such as ridge regression • Initial runs on single trip data sets give very low prediction error values (R-squared)
Motivation: • The SnapWeight is an indication of error rate and is constrained between 0 and 1. We would like to respect this boundary. • Assumption: Beta Regression Beta distribution, parameterized by mean (μ) and precision (ϕ): Regression based on these assumptions: Link Function (e.g. Logit, Cauchy,..)
Beta Regression beta_logitbetareg(formula = SnapWeight ~ Speedx10, data = data.train.small) • Current Problems: • Huge dataset impedes the use of Summary() • Not sure about the effect of IDs and whether it’s necessary to separate them Coefficients in two cases of regression formula: (Intercept) Speedx10 Headingx10 1.170e+00 1.034e-04 -4.888e-05 (Intercept) Speedx10 1.0773586 0.0001835
What’s Next • Fit AR/MA models to many IDs and find most common p and q. Then validate using validation data set. • Regress on larger aggregated data sets and then validate. • Do beta regression with the assumption of non-identical precision parameters, also different link functions • Eliminate incomplete/irrelevant data from corpus, based on both intuition and regression results • Compare different test values • Pick most likely models and apply to untouched Test data.
References • [1] René A. Carmona. Statistical Analysis of Financial Data in S-PLUS. Springer, 2004. • [2] Cribari-Neto, Francisco and Zeileis, Achim (2009) Beta Regression in R. Research Report Series / Department of Statistics and Mathematics, 98. Department of Statistics and Mathematics x, WU Vienna University of Economics and Business, Vienna. • [3] Ferrari, Silvia and Cribari-Neto, Francisco (2004) Beta Regression for Modeling Rates and Proportions. Journal of Applied Sciences, Volume 31, Issue 7.