Download
1 / 29
290 likes | 471 Vues
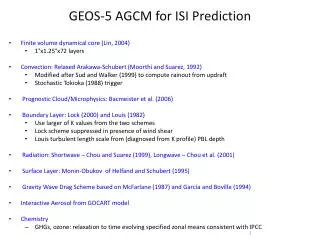
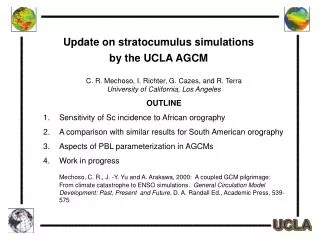
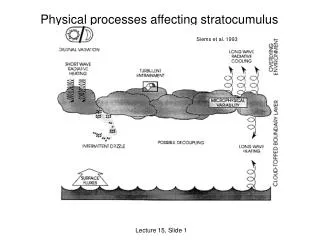
VOCALS-REX CTBL and Aerosols Rob Wood and Chris Bretherton, Univ. of Washington Chris Fairall, NOAA-ETL. Current U.S. AGCM stratocumulus simulations. Decent radiation Imperfect clouds Drizzle significant Cloud-aerosol feedbacks soon. NCAR. GFDL.

E N D
VOCALS-REX CTBL and Aerosols Rob Wood and Chris Bretherton, Univ. of WashingtonChris Fairall, NOAA-ETL
Current U.S. AGCM stratocumulus simulations • Decent radiation • Imperfect clouds • Drizzle significant • Cloud-aerosol feedbacks soon NCAR GFDL (CPT, Wyant et al.2005; also note GCSS BLCWG)
Why did EPIC/VOCALS get into SE Pacific stratocumulus ? • Subtropical boundary-layer cloud errors in coupled climate models induce SST and circulation biases. • The southeast Pacific (SEP) is the largest, cloudiest, cool-ocean region in the tropics, and a comparison to NEP. • TAO and CLIVAR flux-reference buoys provide long-term SEP measurements, but overlying clouds poorly sampled. • SEP buoy maintenance cruises provide opportunities for studying cloud-aerosol-dynamics interaction, indirect effect.
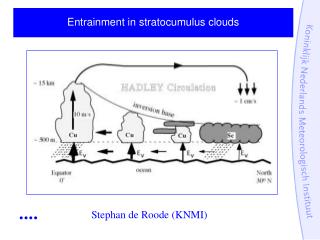
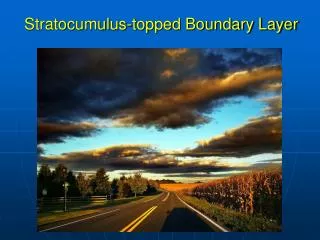
SST (TMI) & winds (Quikscat) EPIC 2001-Sc GOES Visible image IMET Buoy • Showed power of ship-based obs. (sondes+NOAA-ETL radars, ceilometer, surf. flux) • Diurnal cycle & Andean forcing • Cloud-drizzle-dynamics interactions and ‘pockets of open cells’ (POCs) ; possible aerosol link.
Diurnal cycle and drizzle POC Surface-derived LCL Ceilometer cloud base figure by Kim Comstock
u 20 km z=1km
Microphysics and drizzle production Results from EPIC 2001, Bretherton et al. (2004) R(zCB) (mm hr-1) R(zCB) = 0.075(LWP/Nd)1.75 LWP/Nd (g m-2 cm-3)
400 300 200 100 0 PACS 03-05: Aerosol-POC links Na (D>0.1 m) [cm-3] POCs over ship 0.7 0.3 0.1 0.05 0.03 0.01 dN/dlogR [cm-3] accumulation mode (mainly sulfate) particle diameter [m] Aitken mode Tomlinson, Texas A&M day in November 2003
Synergy with NE Pacific cloud-aerosol studies • Airborne (DYCOMS, Monterey CIRPAS): Smaller POCs, near-shore, diurnal cycle not sampled. • AMF (Pt. Reyes): Long-term data but coastal. • DYCOMS/EPIC joint POC paper (Stevens et al.2005) Stevens
Satellite remote sensing of POCsGOES IR (left) and 11-3.7 m brightness temperature difference (BTD, right) BTD Low Nd High Nd 21:00 local, Oct 16
Satellite remote sensing of POCsGOES IR (left) and 11-3.7 m brightness temperature difference (right) BTD Low Nd High Nd 03:00 local, Oct 17
Satellite remote sensing of POCsGOES IR (left) and 11-3.7 m brightness temperature difference (right) BTD Low Nd High Nd 21:00 local, Oct 17
Satellite remote sensing of POCsGOES IR (left) and 11-3.7 m brightness temperature difference (right) BTD Low Nd High Nd 03:00 local, Oct 18
Satellite remote sensing of POCsGOES IR (left) and 11-3.7 m brightness temperature difference (right) 21:00 local, Oct 18
Aerosol sources in the SE Pacific • Chile is world’s largest copper producer • Copper smelting SO2 emissions from Chile (1.5 TgS yr-1) comparable to total SO2 emissions in Germany • 90% of Chilean SO2 emissions from seven smelters! • Andes mountains prevents eastward transport • Biogenic aerosol from coastal zone also important? • Aerosol injected within PBL or entrained from above? • MODIS effective radius retrievals unreliable in inhomogeneous cloud Put Seasonal Mean SON Smelter locations EPIC 2001 meaurements Cloud droplet concentration
Are anthropogenic aerosols suppressing POCs? Polluted solid Sc POC (clean)
What we think • Daytime cloud thinning reduces SEP cloud albedo • POCs lower cloud fraction/albedo • Cellularity in POCs due to mesoscale circulations and ‘cold pools’ driven by evaporating drizzle. • POCs initiate in early a.m. in uniform, aerosol-poor Sc. • POCs self-maintaining by drizzle scavenging of aerosol. • Smelter sulfate inhibits POCs, raises albedo near coast. • Suggests large aerosol indirect effect in Sc regions. • Target for AR5 GCMs incorporating aerosol indirect effects. A combined aircraft-ship study can nail this down! Aircraft – in-situ cloud microphysics, aerosol sampling Ship – long time series in ‘clean’ and ‘polluted’ regimes ... ETL-enhanced Brown is going to stratus buoy anyway
VOCALS-REX atmospheric sampling A combined ship-air strategy to sample cloud-aerosol-dynamics feedbacks and their surface impact across the large SEP systematic offshore gradient of aerosol concentrations. 1. What factors influence drizzle formation and POCs? Is aerosol the critical factor? 2. What are the aerosol characteristics, sources and sinks in the coastal and remote SEP? 3. Do satellite and ship-based retrievals of aerosol, cloud drop radius and drizzle agree with in-situ observations? 4. What is the relative importance of dynamical vs. aerosol variability in controlling SEP stratocumulus cloud cover? • This is part of a broader long-term VOCALS strategy including modeling, measurements of opportunity, and integrated data analysis.
Platforms • NCAR C-130 (120 hrs; 30 days; Wood/Breth/Vali/Yuter): - In situ cloud, aerosol, turbulence sampling - Cloud radar/lidar/dropsonde survey • Brown (43 days; Fairall) - ETL cloud radar/ceilometer/MWR/fluxes/met - Scanning C-band radar - Aerosols (ETL and/or Texas A&M). - Sondes. • Possible externally funded add-ons - C-130 Aerosol/chemistry (Huebert/Bandy-SOLAS; $900K) - NOAA ‘coastal’ P-3 (Aeronomy lab – Feingold) - Aerosondes for POC-tracking (Esbensen; $300K+)
clean aerosol-rich
Cross-section flight plan CloudSat, Calipso Flexibility for day or night A-Train underflights.
POC-sampling missions(repeated flights to an evolving POC if possible) Satellites or optional aerosondes for diurnal cycle sampling
Atmospheric Platforms-‘Skeleton plan’ costs NCAR C-130 ($450K/3yrs - NSF) 120 flight hrs $805K – deployment pool) 120 dropsondes $215K – deployment pool) SABL lidar (EOL) $90K – NSF Wyo. cloud radar TBD PI UWyo: $300K/3yrs + UWash: $450K/3yrs Brown (supplemental above ‘annual’ 18 day CPPA stratus cruise) 4xdaily sondes + NOAA-ETL + aerosol $100 K C-band radar (Yuter) $60K subcontract – NSF PI ETL analysis: $300 K/3yrs – NOAA Optional ETL ship profiler $50K Total out-of-pocket NSF-ATM = $900 K NOAA = $450 K Deploy. pool = $1015 K
VOCALS-REX atmospheric payoffs • Better characterization of aerosol indirect effect in stratocumulus as needed for IPCC AR5 models. • Improved fundamental understanding of POC formation, maintenance, surface flux effects. • Better characterization of both natural and anthropogenic aerosol sources in SEP. • In-situ validation of A-Train drizzle (CloudSat) and daytime/nighttime cloud droplet size/LWP retrievals (MODIS) for stratocumulus. • Unique dataset for testing regional models of diurnal/synoptic variability in/above CTBL. • Context for interpreting long-term stratus buoy surface flux data.
VOCALS GOAL Better understand, simulate, and predict the Southeast Pacific cool-ocean climate regime and its interactions with the larger-scale coupled ocean-atmosphere-land system on diurnal to interannual timescales.
Current U.S. AGCM stratocumulus simulations • Decent radiation • Imperfect clouds • Drizzle significant • Cloud-aerosol feedbacks soon NCAR GFDL A model month at 20S 85W (CPT, Wyant et al.2005; also note GCSS BLCWG)
MODIS-derived cloud droplet radius excessive in broken cloud large (clean) in drizzle
Global cloud droplet concentration estimates (MODIS satellite, annual mean 2001-2004)