Download
1 / 22
220 likes | 342 Vues
The distributional effects of income tax expenditures . Silvia Avram Holly Sutherland EUROMOD Microsimulation Workshop, Lisbon, 2-3 October 2013. Outline. Definitions and terms Motivation Methodology Results Total tax allowances & credits By type Caveats and conclusions.

E N D
The distributional effects of income tax expenditures Silvia Avram Holly Sutherland EUROMOD Microsimulation Workshop, Lisbon, 2-3 October 2013
Outline • Definitions and terms • Motivation • Methodology • Results • Total tax allowances & credits • By type • Caveats and conclusions
Definitions and terms • Tax expenditure • =tax concessions, tax advantages • =“special exclusion, exemption, or deduction from gross income or which provide a special credit, a preferential rate of tax, or a deferral of tax liability”(Congressional Budget Act, 1974) • =provisions that decrease the net tax liability for some taxpayers • include general tax instruments / 0 band rates not distribution neutral • Distinguish between: • Tax allowances= reductions in taxable income • Tax credits= reductions in the initial tax liability • Non-taxable income not covered • Structure (special rates, joint taxation etc.) “given” • Deferred liability treated as an allowance
Motivation • Why tax expenditure? • Important element of income taxation systems • Total forgone revenues may be substantial • Distributional effects not well understood • Previous work: • measures and decomposition of the progressivity of the tax system (Kakwani, 1977; Wagstaff et al., 1999; Wagstaff and Van Doorsaler, 2001; Verbist, 2004) • US studies specific methodology and results (Toder et al., 2009; Althuler and Dietz, 2011) • Not able to fully capture the interaction between the various elements of the tax system (ex: tax concessions affect the ATR) • Not able to capture the interactions with the larger T-B system • Not able to differentiate instruments by their design
Methodology (I) • EUROMOD-simulation of income tax • including most tax concession elements • simulation of entitlements based on household and individual characteristics and income tax rules • (not actual payments) • Value of tax concessions (allowances/ credits): • Gross: difference in net tax liability due to tax concessions (interaction with other elements of the income tax system) • Net: difference in household disposable income due to the tax concessions (interaction with all other elements of the tax-benefit system) • “Dynamic de-composition”
Methodology(II) • Distinguish between: • General =universal instruments applicable to all tax payers (incl. 0 rate tax bands) • Family= instruments targeted to taxpayers with dependents (children, spouses, parents etc.) • Vulnerable groups= instruments targeted at taxpayers (or dependents) perceived to be economically insecure (ex: disabled, elderly, lone parents etc.) • Income related= instruments inversely correlated with (taxable) income • Types not exhaustive and not mutually exclusive! • Value calculated the same way as total (i.e. factoring in the interaction between the various tax concessions)
Methodology(III) • Dynamic de-composition elements do not sum up to total! • Not all tax allowances and credits simulated in EUROMOD (due to lack of info in the underlying dataset) • 6 countries: CZ, DE, DK, ES, FR, IT • 2010 income tax systems • How much is covered: • Comparison of simulated net income tax/ administrative records statistics(2010) in CRs • ....but many sources of inconsistencies some of which cancel each other • Admin sources of tax expenditure needed!
Size: Annual expenditure on TA & TC Source: EUROMOD G 1.0+ & EUROSTAT (for total government revenue)
Size: Proportion entitled by quintile Note: Quintiles are based on household equivalised disposable income when no tax allowances/ credits are present Source: EUROMOD G1.0
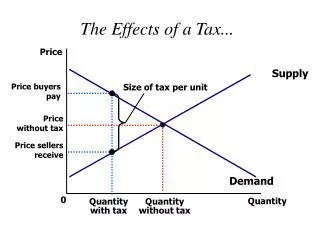
Concentration Curves Tax allowances Tax Credits Source: EUROMOD G1.0
Average TA as % of rank HDI Note: Quintiles are based on household equivalised disposable income when no tax allowances/ credits are present Source: EUROMOD G1.0
General instruments Concentration curve-General tax allowances Concentration curve-General tax credits
Family related instruments Concentration curves-Family tax allowances Concentration curves-Family tax credits
Instruments targeted at vulnerable groups Concentration curves: VG tax allowances Concentration curves: VG tax credits
Income related instruments Concentration curves- IR tax allowances Concentration Curves: IR tax credits
Summary of results (I) • Tax expenditure may be sizeable (~10% of gov. revenue) • Both TA & TC generally regressive • Winners are mostly in the middle and top of the distribution • larger shares of the outlays go to the middle and top of the distributions • Bottom quintile may get (almost) nothing (TA in CZ, TC in FR) • Progressivity varies but generally TAs more regressive than TCs • Some tax instruments can be strongly progressive • Ex: family TAs in DK; family TCs in IT; IR TAs in FR • General instruments-always regressive
Summary of results (II) • The more progressive the tax schedule the stronger the regressive effect of TAs • DE: regressive TAs likely due to the progressivity adjustment • Interaction with the wider TB system can modify impact • FR: TA reducing the income concept used to assess eligibility for many benefits net effect much stronger than gross at the bottom • Interactions between TAs and TCs reducing one increase another • Generally-difficult to target via the tax system • Most of IR/ VG instruments not progressive • Taxpaying unit and incomes used for targeting may limit effectivenss • Overall impact on inequality-small
Caveats • Simulation limitations: • Not all instruments simulated cross-country comparisons more valid in the sub-types than in the aggregate • Not considering the impact of exemptions (i.e. whole categories of income which is not taxed) • Calculations based on theoretical entitlements and liability limited consideration of tax-evasion (IT only) and non-take-up of tax advantages • No behavioural effects