Download
1 / 63
630 likes | 766 Vues
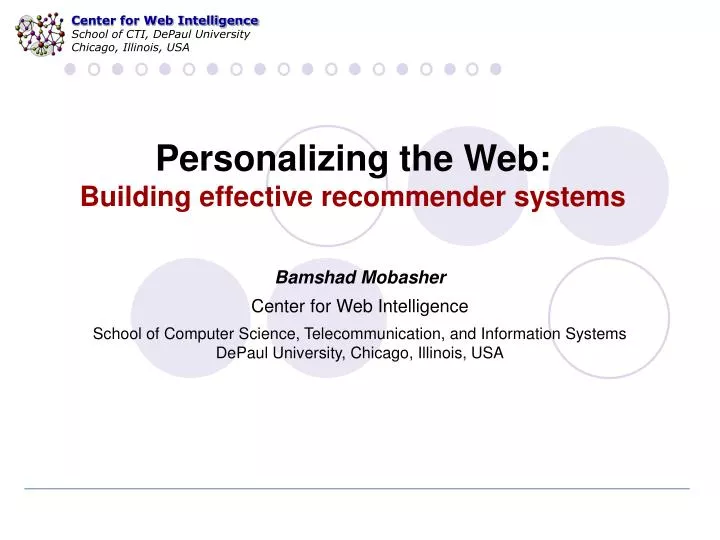
Personalizing the Web: Building effective recommender systems. Bamshad Mobasher Center for Web Intelligence School of Computer Science, Telecommunication, and Information Systems DePaul University, Chicago, Illinois, USA. Outline. Web Personalization & Recommender systems

E N D
Personalizing the Web:Building effective recommender systems Bamshad Mobasher Center for Web Intelligence School of Computer Science, Telecommunication, and Information Systems DePaul University, Chicago, Illinois, USA
Outline • Web Personalization & Recommender systems • Basic Approaches & Algorithms • Special focus on collaborative filtering • Extending Traditional Approaches • Hybrid models • Personalization Based on Data Mining • Vulnerability of Collaborative Filtering to Attacks
Web Personalization • The Problem • Dynamically serve customized content (pages, products, recommendations, etc.) to users based on their profiles, preferences, or expected interests • Common Approaches • Collaborative Filtering • Give recommendations to a user based on preferences of “similar” users • Preferences on items may be explicit or implicit • Content-Based Filtering • Give recommendations to a user based on items with “similar” content in the user’s profile • Rule-Based (Knowledge-Based) Filtering • Provide recommendations to users based on predefined (or learned) rules • age(x, 25-35) and income(x, 70-100K) and childred(x, >=3) recommend(x, Minivan)
Content-Based Recommenders: Personalized Search Agents • How can the search engine determine the “user’s context”? ? Query: “Madonna and Child” ? • Need to “learn” the user profile: • User is an art historian? • User is a pop music fan?
Other Forms of Collaborative Filtering • Social Tagging (Folksonomy) • people add free-text tags to their content • where people happen to use the same terms then their content is linked • frequently used terms floating to the top to create a kind of positive feedback loop for popular tags. • Examples: • Del.icio.us • Flickr • QLoud & iTunes
The Recommendation Task • Basic formulation as a prediction problem • Typically, the profile Pu contains preference scores by u on some other items, {i1, …, ik} different from it • preference scores on i1, …, ik may have been obtained explicitly (e.g., movie ratings) or implicitly (e.g., time spent on a product page or a news article) Given a profilePu for a user u, and a target itemit, predict the preference score of user u on item it
Content-Based Recommenders • Predictions for unseen (target) items are computed based on their similarity (in terms of content) to items in the user profile. • E.g., user profile Pu contains recommend highly: and recommend “mildly”:
Collaborative Recommender Systems • Collaborative filtering recommenders • Predictions for unseen (target) items are computed based the other users’ with similar interest scores on items in user u’s profile • i.e. users with similar tastes (aka “nearest neighbors”) • requires computing correlations between user u and other users according to interest scores or ratings • k-nearest-neighbor (knn) strategy Can we predict Karen’s rating on the unseen item Independence Day?
Basic Collaborative Filtering Process Current User Record <user, item1, item2, …> Nearest Neighbors Recommendation Engine Neighborhood Formation Combination Function Historical User Records Recommendations user rating item Recommendation Phase Neighborhood Formation Phase Both of the Neighborhood formation and the recommendation phases are real-time components
Collaborative Filtering: Measuring Similarities • Pearson Correlation • weight by degree of correlation between user U and user J • 1 means very similar, 0 means no correlation, -1 means dissimilar • Works well in case of user ratings (where there is at least a range of 1-5) • Not always possible (in some situations we may only have implicit binary values, e.g., whether a user did or did not select a document) • Alternatively, a variety of distance or similarity measures can be used Average rating of user J on all items.
Collaborative Recommender Systems • Collaborative filtering recommenders • Predictions for unseen (target) items are computed based the other users’ with similar interest scores on items in user u’s profile • i.e. users with similar tastes (aka “nearest neighbors) • requires computing correlations between user u and other users according to interest scores or ratings prediction Correlation to Karen Predictions for Karen on Indep. Day based on the K nearest neighbors
Collaborative Filtering: Making Predictions • When generating predictions from the nearest neighbors, neighbors can be weighted based on their distance to the target user • To generate predictions for a target user a on an item i: • ra = mean rating for user a • u1, …, ukare the k-nearest-neighbors to a • ru,i = rating of user u on item I • sim(a,u) = Pearson correlation between a and u • This is a weighted average of deviations from the neighbors’ mean ratings (and closer neighbors count more)
Example Collaborative System Prediction Bestmatch Using k-nearest neighbor with k = 1
Item-based Collaborative Filtering • Find similarities among the items based on ratings across users • Often measured based on a variation of Cosine measure • Prediction of item I for user a is based on the past ratings of user a on items similar to i. • Suppose: • Predicted rating for Karen on Indep. Day will be 7, because she rated Star Wars 7 • That is if we only use the most similar item • Otherwise, we can use the k-most similar items and again use a weighted average sim(Star Wars, Indep. Day) > sim(Jur. Park, Indep. Day) > sim(Termin., Indep. Day)
Item-Based Collaborative Filtering Prediction Bestmatch
Collaborative Filtering: Evaluation • split users into train/test sets • for each user a in the test set: • split a’s votes into observed (I) and to-predict (P) • measure average absolute deviation between predicted and actual votes in P • MAE = mean absolute error • average over all test users
Semantically Enhanced Collaborative Filtering • Basic Idea: • Extend item-based collaborative filtering to incorporate both similarity based on ratings (or usage) as well as semantic similarity based on domain knowledge • Semantic knowledge about items • Can be extracted automatically from the Web based on domain-specific reference ontologies • Used in conjunction with user-item mappings to create a combined similarity measure for item comparisons • Singular value decomposition used to reduce noise in the semantic data • Semantic combination threshold • Used to determine the proportion of semantic and rating (or usage) similarities in the combined measure
Semantically Enhanced Hybrid Recommendation • An extension of the item-based algorithm • Use a combined similarity measure to compute item similarities: • where, • SemSim is the similarity of items ip and iq based on semantic features (e.g., keywords, attributes, etc.); and • RateSim is the similarity of items ip and iq based on user ratings (as in the standard item-based CF) • is the semantic combination parameter: • = 1 only user ratings; no semantic similarity • = 0 only semantic features; no collaborative similarity
Semantically Enhanced CF • Movie data set • Movie ratings from the movielens data set • Semantic info. extracted from IMDB based on the following ontology
Semantically Enhanced CF • Used 10-fold x-validation on randomly selected test and training data sets • Each user in training set has at least 20 ratings (scale 1-5)
Semantically Enhanced CF • Dealing with new items and sparse data sets • For new items, select all movies with only one rating as the test data • Degrees of sparsity simulated using different ratios for training data
Collaborative Filtering: Problems • Problems with standard CF • major problem with CF is scalability • neighborhood formation is done in real-time • small number of users relative to items may result in poor performance • data become too sparse to provide accurate predictions • “new item” problem • Vulnerability to attacks (will come back to this later) • Problems in context of clickstream / e-commerce data • explicit user ratings are not available • features are binary (visit or a non-visit for a particular item) or a function of the time spent on a particular item • a visit to a page is not necessarily an indication of interest in that item • number of user records (and items) is far larger than the standard domains for CF where users are limited to purchasers or people who rated items • need to rely on very short user histories
Web Mining Approach to Personalization • Basic Idea • generate aggregate user models (usage profiles) by discovering user access patterns through Web usage mining (offline process) • Clustering user transactions • Clustering items • Association rule mining • Sequential pattern discovery • match a user’s active session against the discovered models to provide dynamic content (online process) • Advantages • no explicit user ratings or interaction with users • helps preserve user privacy, by making effective use of anonymous data • enhance the effectiveness and scalability of collaborative filtering
Web Usage Mining • Web Usage Mining • discovery of meaningful patterns from data generated by user access to resources on one or more Web/application servers • Typical Sources of Data: • automatically generated Web/application server access logs • e-commerce and product-oriented user events (e.g., shopping cart changes, product clickthroughs, etc.) • user profiles and/or user ratings • meta-data, page content, site structure • User Transactions • sets or sequences of pageviews possibly with associated weights • a pageview is a set of page files and associated objects that contribute to a single display in a Web Browser
Data Preparation Phase Pattern Discovery Phase Web & Application Server Logs Pattern Analysis Site Content & Structure Pattern Filtering Aggregation Characterization Aggregate Usage Profiles Data Preprocessing Usage Mining Data Cleaning Pageview Identification Sessionization Data Integration Data Transformation Transaction Clustering Pageview Clustering Correlation Analysis Association Rule Mining Sequential Pattern Mining Domain Knowledge Patterns User Transaction Database Personalization Based on Web Usage Mining Offline Process
Recommendation Engine Aggregate Usage Profiles <user,item1,item2,…> Integrated User Profile Recommendations Stored User Profile Domain Knowledge Active Session Web Server Client Browser Personalization Based on Web Usage Mining: Online Process
Conceptual Representation of User Transactions or Sessions Pageview/objects Session/user data Raw weights are usually based on time spent on a page, but in practice, need to normalize and transform.
Web Usage Mining: clustering example • Transaction Clusters: • Clustering similar user transactions and using centroid of each cluster as a usage profile (representative for a user segment) Sample cluster centroid from CTI Web site (cluster size =330)
Using Clusters for Personalization Given an active session A B, the best matching profile is Profile 1. This may result in a recommendation for page F.html, since it appears with high weight in that profile. Original Session/user data Result of Clustering PROFILE 0 (Cluster Size = 3) -------------------------------------- 1.00 C.html 1.00 D.html PROFILE 1 (Cluster Size = 4) -------------------------------------- 1.00 B.html 1.00 F.html 0.75 A.html 0.25 C.html PROFILE 2 (Cluster Size = 3) -------------------------------------- 1.00 A.html 1.00 D.html 1.00 E.html 0.33 C.html
Profile Injection Attacks • Consist of a number of "attack profiles" • added to the system by providing ratings for various items • engineered to bias the system's recommendations • Two basic types: • “Push attack” (“Shilling”): designed to promote an item • “Nuke attack”: designed to demote a item • Prior work has shown that CF recommender systems are highly vulnerable to such attacks • Attack Models • strategies for assigning ratings to items based on knowledge of the system, products, or users • examples of attack models: “random”, “average”, “bandwagon”, “segment”, “love-hate”
A Successful Push Attack BestMatch Prediction “user-based” algorithm using k-nearest neighbor with k = 1
A Generic Attack Profile IS IF IÆ • Attack models differ based on ratings assigned to filler and selected items Ratings for lfiller items Unrated items in the attack profile Ratings for kselected items Rating for the target item
Average and Random Attack Models IF IÆ • Random Attack: filler items are assigned random ratings drawn from the overall distribution of ratings on all items across the whole DB • Average Attack: ratings each filler item drawn from distribution defined by average rating for that item in the DB • The percentage of filler items determines the amount knowledge (and effort) required by the attacker Rating for the target item Unrated items in the attack profile Random ratings for lfiller items
Bandwagon Attack Model IS IF IÆ • What if the system's rating distribution is unknown? • Identify products that are frequently rated (e.g., “blockbuster” movies) • Associate the pushed product with them • Ratings for the filler items centered on overall system average rating (Similar to Random attack) • frequently rated items can be guessed or obtained externally Random ratings for lfiller items Ratings for kfrequently rated items Unrated items in the attack profile Rating for the target item
Segment Attack Model IF IS IÆ • Assume attacker wants to push product to a target segment of users • those with preference for similar products • fans of Harrison Ford • fans of horror movies • like bandwagon but for semantically-similar items • originally designed for attacking item-based CF algorithms • maximize sim(target item, segment items) • minimize sim(target item, non-segment items) Rating for the target item Ratings for kfavorite items in user segment Ratings for lfiller items Unrated items in the attack profile
Nuke Attacks: Love/Hate Attack Model IF IÆ Min rating for the target item Unrated items in the attack profile Max rating for lfiller items • A limited-knowledge attack in its simplest form • Target item given the minimum rating value • All other ratings in the filler item set are given the maximum rating value • Note: • Variations of this (an the other models) can also be used as a push or nuke attacks, essentially by switching the roles of rminand rmax.
How Effective Can Attacks Be? • First A Methodological Note • Using MovieLens 100K data set • 50 different "pushed" movies • selected randomly but mirroring overall distribution • 50 users randomly pre-selected • Results were averages over all runs for each movie-user pair • K = 20 in all experiments • Evaluating results • prediction shift • how much the rating of the pushed movie differs before and after the attack • hit ratio • how often the pushed movie appears in a recommendation list before and after the attack
Example Results: Average Attack • Average attack is very effective against user based algorithm (Random not as effective) • Item-based CF more robust (but vulnerable to other attack types such as “segment attack” [Burke & Mobasher, 2005]
Example Results: Bandwagon Attack • Only a small profile needed (3%-7%) • Only a few (< 10) popular movies needed • As effective as the more data-intensive average attack (but still not effective against item-based algorithms)
Results: Impact of Profile Size Only a small number of filler items need to be assigned ratings. An attacker, therefore, only needs to use part of the product space to make the attack effective. In the item-based algorithm we don’t see the same drop-off, but prediction shift shows a logarithmic behavior – near maximum at about 7% filler size.
Example Results: Segmented Attack Against Item-Based CF • Very effective against targeted group • Best against item-based • Also effective against user-based • Low knowledge
Possible Solutions • Explicit trust calculation? • select peers through network of trust relationships • law of large numbers • hard to achieve numbers needed for CF to work well • Hybrid recommendation • Some indications that some hybrids may be more robust • Model-based recommenders • Certain recommenders using clustering are more robust, but generally at the cost of less accuracy • But a probabilistic approach has been shown to be relatively accurate [See: Model-Based Collaborative Filtering as a Defense Against Profile Injection Attacks, B. Mobasher, R. Burke, JJ Sandvig. AAAI 2006, Boston.] • Detection and Response
Results: Semantically Enhanced Hybrid Semantic features extracted for movies: top actors, director, genre, synopsis (top keywords), etc. Alpha 0.0 = 100% semantic item-based similarity Alpha 1.0 = 100% collaborative item-based similarity
Approaches to Detection & Response Profile Classification • Classification model to identify attack profiles and exclude these profiles in computing predictions • Uses the characteristic features of most successful attack models • Designed to increase cost of attacks by detecting most effective attacks Anomaly Detection • Classify Items (as being possibly under attack) • Not dependent on known attack models • Can shed some light on which type of items are most vulnerable to which types of attacks But, what if the attack does not closely correspond to known attack signature In Practice: need a comprehensive framework combining both approaches
Anomaly Detection: Using Control Charts A new item’s average rating Observations: avg. ratings on training items in a particular category, assuming no biased ratings Upper and lower boundaries on average ratings of items used as signal thresholds for push and nuke attacks, respectively.
Anomaly Detection: Using Time Series A sudden change in an item’s mean rating may indicate a suspicious pattern