Download
1 / 31
310 likes | 667 Vues
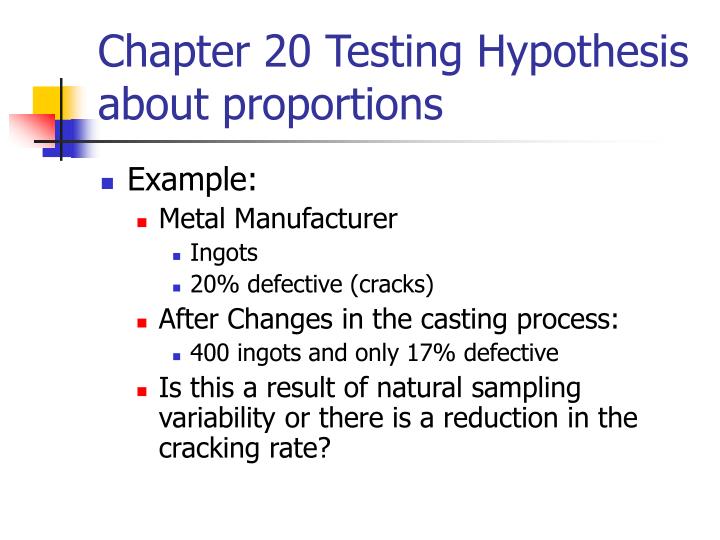
Chapter 20 Testing Hypothesis about proportions. Example: Metal Manufacturer Ingots 20% defective (cracks) After Changes in the casting process: 400 ingots and only 17% defective Is this a result of natural sampling variability or there is a reduction in the cracking rate?. Hypotheses.

E N D
Chapter 20 Testing Hypothesis about proportions • Example: • Metal Manufacturer • Ingots • 20% defective (cracks) • After Changes in the casting process: • 400 ingots and only 17% defective • Is this a result of natural sampling variability or there is a reduction in the cracking rate?
Hypotheses • We begin by assuming that a hypothesis is true (as a jury trial). • Data consistent with the hypothesis: • Retain Hypothesis • Data inconsistent with the hypothesis: • We ask whether they are unlikely beyond reasonable doubt. • If the results seem consistent with what we would expect from natural sampling variability we will retain the hypothesis. But if the probability of seeing results like our data is really low, we reject the hypothesis.
Testing Hypotheses • Null Hypothesis H0 • Specifies a population model parameter of interest and proposes a value for this parameter • Usually: • No change from traditional value • No effect • No difference • In our example H0:p=0.20 • How likely is it to get 0.17 from sample variation?
Testing Hypotheses (cont.) • Normal Sampling distribution • How likely is to observe a value at least 1.5 standard deviations below the mean of a normal model • Management must decide whether an event that would happen 6.7% of the time by chance is strong enough evidence to conclude that the true cracking proportion has decreased
A Trial as a Hypothesis Test • The jury’s null hypothesis is • H0 : innocent • If the evidence is too unlikely given this assumption, the jury rejects the null hypothesis and finds the defendant guilty. But if there is insufficient evidence to convict the defendant, the jury does not decide that H0 is true and declare him innocent. Juries can only fail to reject the null hypothesis and declare the defendant “not guilty”
The Reasoning of Hypothesis Testing • Hypothesis • To perform a hypothesis test, we must specify an alternative hypotheses. Remember we can never prove a null hypothesis, only reject it or retain it. If we reject it, we then accept the alternative • Example: Pepsi or Coke • p : proportion preferring coke • H0 : p = 0.50 • HA : p ≠ 0.50
The Reasoning of Hypothesis Testing (cont.) • Plan • Specify the model and test you will use (proportions, means). • We call this test about the value of a proportion a one-proportion z-test • Mechanics • Actual Calculation of a test from the data. • P-value : the probability that the observed statistic value could occur if the null model were correct. If the P-value is small enough, we reject the null hypothesis
The Reasoning of Hypothesis Testing (cont.) • Conclusion • The conclusion in a hypothesis test is always a statement about the null hypothesis. The conclusion must state either that we reject or that we fail to reject the null hypothesis
Alternatives • Two-sided Alternative • HA : p ≠ 0.50 (Pepsi – Coke) • The P-value is the probability of deviating in either direction from the null hypothesis • One-sided Alternative • H0 : p = 0 • HA : p < 0.20 (Ingots) • The P-value is the probability of deviating only in the direction of the alternative away from the null hypothesis value.
Exercises • Page 467 • #1 • #3 • #20
Chapter 21More About Tests • Example : Therapeutic Touch (TT) • One-proportion z-test • 15 TT practitioners 10 trials each • H0 : p=0.50 • HA : p>0.50 • Random Sampling • Independence • 10% condition • Success/Failure condition • Observed proportion 0.467 • Find the P-value…
How to Think About P-values • A P-value is a conditional probability. It is the probability of the observed statistic given that the null hypothesis is true. • P-value : P(Observed statistic value|H0)
Alpha Levels • When the P-value is small, it tells us that our data are rare given the null hypothesis. • We can define a “rare event” arbitrarily by setting a threshold for our P-value. • If our P-value falls below that point we’ll reject the null hypothesis. We call such results “statistically significant” the threshold is called an alpha level or significance level.
Alpha Levels (cont.) • = 0.10 • = 0.05 • = 0.01 • Rejection Region • One Sided Two sided
Making Errors • Type I error • The null hypothesis is true, but we mistakenly reject it. • Type II error • The null hypothesis is false but we fail to reject it.
Types of errors • Examples • Medical disease testing • I : False Positive • II : False Negative • Jury Trial • I : Convicting an innocent • II : Absolving someone guilty
Probabilities of errors • To reject H0, the P-value must fail below . When H0 is true that happens exactly with probability so when you choose the level , you are setting the probability of a Type I error to . • When H0 is false and we fail to reject it, we have made a Type II error. We assign the letter to the probability of this mistake
Power • The power of a test is the probability that it correctly rejects a false null hypothesis. When the power is high, we can be confident that we’ve looked hard enough. • We know that is the probability that a test fails to reject a false null hypothesis, so the power of the test is the complement 1 - • When we calculate power, we have to imagine that the null hypothesis is false. The value of the power depends on how far the truth lies from the null hypothesis value. We call this distance between the null hypothesis value p0 and the truth p the effect size.
Chapter 22Comparing Two Proportions • Recall (Ch.16) • The variance of the sum or difference of two independent random quantities is the sum of their individual variances • Example of the cereals
Comparing Two Proportions (cont.) • The Standard Deviation of the Difference Between Two Proportions • For proportions from the data
Assumptions and Conditions • Random Sampling • 10% condition • Independent Samples Condition • The two groups we are comparing must also be independent of each other (usually evident from the way the data is collected). • Example : • Same group of people before and after a treatment are not independent • Success and failure condition in each sample
The Sampling Distribution • The sampling distribution for a difference between two independent proportions • Provided the assumptions and conditions the sampling distribution of is modeled by a normal model with mean and standard deviation
A two-proportion z-interval • When the conditions are met, we are ready to find the confidence interval for the difference of two proportions p1-p2. Using the standard error of the difference • The interval is • The critical value z* depends on the particular confidence level.
Exercises • Two-proportion z-interval (page 493, 496)
Example • Snoring • Random sample of 1010 Adults • From 995 respondents: • 37% snored at least few nights a week • Splitting in two age categories: • Under 30 Over 30 • 26.1% of 184 39.2% of 811 • Is the difference of 13.1% real or due only to sampling variability?
Example (cont. snoring) • H0 : p1 – p2 = 0 • But p1 and p2 are linked from H0 • p1 = p2 • Pooling: • Combining the counts to get an overall proportion
Two-Proportion z-test • The conditions for the two-proportion z-test are the same as for the two-proportion z-interval . We are testing the hypothesis: • H0 : p1 = p2 • Because we hypothesize that the proportions are equal, we pool them to find • And we use the pooled value to estimate the standard error
Two-Proportion z-test (cont.) • Now we find the test statistic using the statistic • When the conditions are met and the null hypothesis is true, this statistic follows the standard Normal model, so we can use that model to obtain a P-value
Example (cont. snoring) • Randomization 10% Condition • Independent samples condition Success / Failure • The P-value is the probability of observing a difference greater or equal to 0.131 • The two sided P-value is 0.0008. This is rare enough, so we reject the null hypothesis and conclude that there us a difference in the snoring rate between this two age groups.
Exercise • Page 508 #16
Homework #5 • Page 423 #8, 16 • Page 443 #12, 18 • Page 467 #2, 4, 6, 12 • Page 491 #20