Download
1 / 35
350 likes | 720 Vues
Introductions Scott Budman NBC 11 Technology & Business Reporter Welcome Raghav Lal Senior Vice President, Small Business, Visa USA Then and Now: Comprehending the New Economy Guy Kawasaki Managing Director, Garage Technology Ventures The Role of Small Business Nigel Ives

E N D
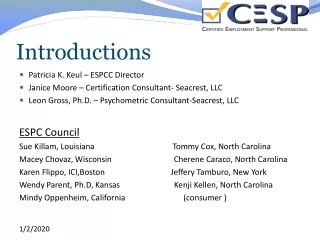
Introductions Scott Budman NBC 11 Technology & Business Reporter
Welcome Raghav Lal Senior Vice President, Small Business, Visa USA
Then and Now: Comprehending the New Economy Guy Kawasaki Managing Director, Garage Technology Ventures
The Role of Small Business Nigel Ives Vice President, Western Region, NFIB
California Small Business Conditions Bill Dunkelberg, Chief Economist, NFIB
Outlook For General Business ConditionsIn 6 Months for the US (PCT “Better” - PCT “Worse”)
Small Business OptimismIndex for the US (Monthly, 1986=100) Seasonally Adjusted
NFIB California OutlookOverall Business Conditions Improving
California Policy Climate: Review and Outlook Lawrence McQuillan, Director, Business and Economic Studies, Pacific Research Institute
U.S. Economic Freedom Index 41 to 50 (10) 31 to 40 (10) 21 to 30 (10) 11 to 20 (10) 1 to 10 (10)
Cost Of Doing Business In CA 30% Above Western State Average Relative cost of doing business 1.5 1.30 .16 .06 .03 .05 <.01 1.00 1.0 19%Higher 127%Higher 77%Higher 105% Higher 25%Higher 0.5 0.0 Averageof Western States Taxes Electricity Propertycosts State Regulatory Employeecosts California Source: CB Richard Ellis, Energy Information Administration, Milken Institute, Beacon Hill
CA State Regulatory Costs Are More Than Double Those Of The Average Western State … Regulatory Cost Index (100=US Avg.) Bain Regulatory Cost Index (US=100) Very high (>150) 200 High (120-150) Moderate (100-119) Low(85-99) 150 Very Low (<85) US Average = 100 100 Western State Average = 83 50 0 CA TX WA NV OR AZ UT Western states calculation includes: AZ, CO, NM, NV, OR, UT, WA Source: US Census, Harris Interactive, EPA, US Dept. of Labor; Small Business Survival Index, OR Dept of Consumer and Business Services; Bain analysis
WA WA MT MT ME ME ND ND MN MN VT VT OR OR ID ID NH NH NY NY WI WI MI MI SD SD MA MA CT CT WY WY RI RI IA IA PA PA NE NE NJ NJ NV NV OH OH UT UT DE DE IL IL IN IN CA CA WV WV CO CO MD MD KS KS VA VA MO MO KY KY NC NC TN TN AZ AZ OK OK NM NM AR AR SC SC GA GA AL AL MS MS TX TX AK AK LA LA FL FL HI HI Cost of doing business in CA 30% above Western state average Regulatory Cost Index (100=US Avg.) Very high (>150) High (120-150) Moderate (100-119) Low(85-99) Very Low (<85) Source: US Census, Harris Interactive, EPA, US Dept. of Labor; Small Business Survival Index, OR Dept of Consumer and Business Services; Bain analysis
Federal regulatory costs per employee for small businesses are $7,647. 45% higher costs for small firms than for large firms. Differential drivers: Tax Compliance 67% higher Environmental Regs 364% higher Source: “The Impact of Regulatory Costs on Small Firms” by W. Mark Crain, 2005 Small business suffers most from regulation
Super-Sized Verdicts In California 100 Largest Verdicts in U.S. (2001 and 2002) $11.3B $38.1B 100% Other Western States 80 Non-Western 60 States 40 20 CA 0 2001 2002 # of CA verdicts: 16 14 Source: National Law Journal’s 100 largest verdicts (2001, 2002)
Live Free or Move • In every year from 1993-2002, more jobs and firms left California than entered. Source: “Are Businesses Fleeing the State?” by David Neumark, Junfu Zhang, and Brandon Wall, 2005
Organize Reform . . . Exempt small business from more federal and state regs Enact simple flat tax at federal & state levels Enact state constitutional tax and spending limit Abolish punitive damages in civil cases Enact “loser pays” rule Establish special medical courts Structural Solutions for California
Consumer Spending: National & Western U.S. Commercial Consumption Expenditures™: Small Business Outlook Wayne Best, Senior Vice President, Business & Economic Analysis, Visa USA
West Growth In Consumer Spending Continues 16% 13% Visa System 10% Mar Apr May Jun Jul Aug Sep Oct 2005 ISF010 |27
West-T&E System-T&E West-Retail System-Retail Strong Consumer Spending In The West 19% 14% 9% 2005 ISF010 |28
System-Discount / Mass / Drug Stores West-Discount / Mass / Drug Stores West- Dept Stores System-Dept Stores Consumers Return To Department Stores, But Discount Stores Still Lead In Growth 17% 8% 1% 2005 ISF010 |29
West-Home & Garden Supplies System-Home & Garden Supplies Retail Growth In The West Driven By Increased Home Values 37% 14% West-Home Furnishings System-Home Furnishings 9% 2005 ISF010 |30
Commercial Consumption Expenditures™ • Commercial Consumption Expenditures™ (CCE) measures the annual dollar value of purchases made from one business to another, and the purchases governments make from businesses. • CCE combines different publicly available data series to capture both intermediate purchase transactions and capital expenditures made to produce a final good or service. ISF010 |31
$8.6 Trillion (e) $16.2 Trillion (f) Payment Company Share of CCE 2.3% General PurposeCard Share of PCE 25% 2005 2005 Benchmarking Payment Company Penetration And Opportunities ISF010 |32 General Purpose card share includes Visa, MasterCard, American Express total products purchase volume (excludes online debit) Source: Visa Quarterly Statistical Highlights and Visa estimates
Forecast Commercial Consumption Expenditures™ $ Trillions $17.3 $16.8 18 $16.2 $15.2 $14.0 12 6 $5.1 $4.9 $4.7 $4.4 $4.1 0 ‘03 ‘04 ‘05 ‘06 ‘07 6.1% 3.0% 4.8% Total 9.1% 3.8% Yr/Yr 5.4% 4.4% 4.5% Small Business 7.4% 4.3% Growth ISF010 |33 Source: Bureau of Economic Analysis, Census Bureau, Global Insight, Visa Business and Economic Analysis
Industry Share of Small Business Segment Spending Agriculture 2.9% Transportation 2.4% Accommodation & Food Services 4.0% Health Care Retail20.3% 5.7% Professional Services 6.6% 8.9% Construction Manufacturing13.0% Real Estate 9.1% WholesaleTrade14.2% Other 12.9% 2005(e) CCE $4.7 Trillion Small Business Segment Share Of Spending Spending byMarket Segment Small Business29% Mid/Large61% Public10% 2005(e) CCE $16.2 Trillion ISF010 |34 Source: Global Insight, Visa Business and Economic Analysis