Download
1 / 26
260 likes | 726 Vues
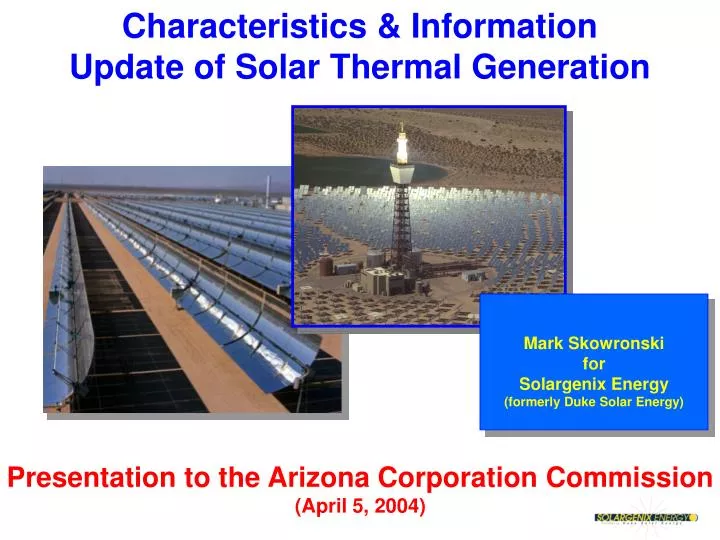
Characteristics & Information Update of Solar Thermal Generation Mark Skowronski for Solargenix Energy (formerly Duke Solar Energy) Presentation to the Arizona Corporation Commission (April 5, 2004) Simplified Schematic of Parabolic Trough Solar Collector Parabolic Trough Collector

E N D
Characteristics & Information Update of Solar Thermal Generation Mark Skowronski for Solargenix Energy (formerly Duke Solar Energy) Presentation to the Arizona Corporation Commission (April 5, 2004)
Parabolic Trough Collector • Typically tracks sun E-W on N-S axis • High temperature oil flows through receiver • Receiver highly efficient due to vacuum annulus and selective surface • Major cost elements: structure, receivers, reflectors • Mirror washing proven to be very effective
Example Configuration Gas Turbine: 162 MW Steam Turbine: 90 MW w/o solar system 131 MW with solar system Total CC net power: 246 MW w/o solar; 285 MW with solar Solar contribution: 16.1% peak; 7% annual MWh Solar Combined Cycle Systems-Offers Additional Cost Savings
Kramer Junction, Calif. Five 30-MWe Trough Plants US 395 KJ SEGS Plants CA 58 Edwards AF Base • 354 MWe installed • 7000 GWH operations • 110% peak availability • $1.25 Billion invested • Matured O&M procedures • Technical advances lowered costs
SEGS Next Plant New Experience Curve Pr = 0.855 Trough Learning Curve
Solar Thermal Trough Provides Competitive Firm Capacity and Energy when Fairly Evaluated against Greenfield CT Costs 5. Hybrid CT's LEC corrected to Muni financing and adjusted Capacity Factor (~8.5 cents) 4. Pre-Pay No Subsidy Case Base w/ 1 Cent PTC 3. Muni Own Base w/ 1.5 Cent PTC 2. Debt Re-pay 1. Base Case 0 2 4 6 8 10 12 14 Levelized Electricity Costs (LEC in cents/kWh) Multiple Ownership Scenarios Offer Opportunity to AZ Utilities to Cost Effectively Meet RPS Goals
Solar Thermal is the only renewable in the wholesale market that can supply firm capacity and energy to AZ for peaking Solar Thermal has established outstanding reliability in So Cal with over 20 years of operation (SEGS) Solar Thermal can supply AZ without the added cost and risk of long distance transmission lines Solar Thermal can economically compete with its fossil equivalent (Combustion Turbines) Solar Thermal Provides Value to the AZ Grid
An Overview ofConcentrating Solar Power SOLAR POWER TOWER Dr. Thomas R. Mancini CSP Program Manager Sandia National Laboratories Albuquerque, New Mexico, USA Presentation for the Arizona Corporation Commission April 5, 2004
565C 288C Hot Salt Cold Salt Steam Generator Conventional EPGS Molten-Salt Power Tower “Power Tower” or “Central Receiver” Energy collection decoupled from power production
Arizona Solar Resources are Immense! • Start with direct normal solar resource estimates derived from 10 km satellite data with modifications by NREL. • Exclude: • locations with less than 6.75 kwh/m2/day • environmentally sensitive lands, major urban areas, and water features. • land areas with greater than 1% average land slope • areas with a minimum contiguous area of less than 10 square kilometers.
Siting AnalysisPotential Locations Preliminary sites identified based on transmission access and located near load centers Location 1 Location 2
Storage provides decouplingof energy collection and generation lower costs because storage is cheaper than incremental turbine costs higher value because power production can match utility needs zero emissions Cost-Effective Storage is the Key! From Storage
The Solar Two Demonstration After 10-15 years of salt development R&D Consortium of 8 utilities, EPRI, CEC, DOE, SunLab formed in early 1990’s to cost-share a demonstration project Solar Two Objectives • Validate technical characteristics • Improve accuracy of economic projections • Simulate design of 100 MWe plant • Collect, evaluate and distribute knowledge gained • Stimulate consortium capable of building commercial plants All Objectives Were Met
Projected Costs No commercial power tower plants have been built anywhere in the world. A 40 MW (equivalent) power tower has been proposed in Spain. Cost projections are based on Sargent & Lundy study performed for the National Academy of Sciences. ¢/kWh S&L SunLab | | | | 1000 2000 3000 4000 Megawatts * ASSESSMENT OF PARABOLIC TROUGH AND POWER TOWER SOLAR TECHNOLOGY COST AND PERFORMANCE FORECASTS, SL-5641 MAY 2003.
Emissions and Leveraging There are no emissions from a power tower plant. Leveraging opportunities for CSP technologies include participation in the 1000 MW CSP southwestern initiative currently being considered by the Western Governors’ Association.
Economic Benefits to the State • At its peak, installation of 1000 MW of CSP power plants would create nearly 7,000 new jobs. • New jobs will be created to build, assemble and operate the CSP plants. • 1000 MW would result in $300 - $500M increase to Arizona’s annual GSP. • 1000 MW will result in local CSP design, construction, and operating experience, allowing Arizona to export these services to neighboring states.
Overall Evaluation of CSP Must Include Value of Product Delivered as Well as Cost • Firm on peak energy considerably more valuable than “as-available” energy during non peak times • Only Solar thermal can provide renewable on-peak generation or (with storage) whenever energy is needed • Following graphs correspond to the Calif PUC rules governing how energy is evaluated on an “all-in” energy cost basis • Value isn’t necessarily defined as lowest LEC
*Generation Cost Comparison Report (Oct 2003) Levelized Costs of Electricity of CT and CC as Function of Capacity Factor (Based on Calif PUC Rule No. 6 Issued June 19 2003) 35 30 25 CT Cost 15.7 cents/kWh at 9.8% 20 Capacity Factor per CEC Report* LEC (cents/kWh) CC Cost 5.2 cents/kWh at 90% 15 Capacity Factor per CEC Report* 10 Combustion Turbine 5 Combined Cycle 0 4 6 8 10 12 14 16 18 20 22 24 26 28 30 35 40 45 50 55 60 65 Capacity Factor (%)
*Generation Cost Comparison Report (Oct 2003) Solar/Boiler Levelized Costs of Electricity vs CT and CC as Function of Capacity Factor (Based on Calif PUC Rule No. 6 Issued June 19 2003) 35 PUC Value ~ $29 Million Cost at ~12 cents/kWh ~ $28 Million 30 40 % Capacity Factor 25 CT Cost 15.7 cents/kWh at 9.8% Capacity Factor per CEC Report* 20 LEC (cents/kWh) CC Cost 5.2 cents/kWh at 90% 15 Capacity Factor per CEC Report* 12 cent/kWh 10 Combustion Turbine 5 Combined Cycle 0 4 6 8 10 12 14 16 18 20 22 24 26 28 30 35 40 45 50 55 60 65 Capacity Factor (%)
*Generation Cost Comparison Report (Oct 2003) Peaking Solar Levelized Costs of Electricity vs CT and CC as Function of Capacity Factor (Based on PUC Rule No. 6 Issued June 19 2003) 35 PUC Value ~ $40 Million Cost at ~13 cents/kWh ~ $31 Million 30 25 CT Cost 15.7 cents/kWh at 9.8% 16 % Capacity Factor Capacity Factor per CEC Report* 20 LEC (cents/kWh) CC Cost 5.2 cents/kWh at 90% 15 Capacity Factor per CEC Report* 13 cent/kWh 10 Combustion Turbine 5 Combined Cycle 0 4 6 8 10 12 14 16 18 20 22 24 26 28 30 35 40 45 50 55 60 65 Capacity Factor (%)
$0.50 100 MW CSP Plant in Arizona $0.40 $0.30 Monthly Cost per Residential Ratepayer $0.20 $0.10 $0.00 1 2 3 4 5 6 7 8 9 10 11 12 13 14 Incremental Cost Over 2006 Natural Gas Plant -- ¢ /kWh Cost to Arizona Ratepayer for 100 MW Solar Thermal Plant as Function of Overcharge
CSP (Trough or Central Receiver) Provides Multiple Benefits to AZ Ratepayers • Firm Energy at Competitive Pricing when evaluated against comparable products (See PUC Rule No. 6) • Creation of Jobs • 3 to 4 times more construction jobs • Potential to locate manufacturing facility in state • 2 to 3 times more operating personnel • Creation of Tax Base • Tax base of 3 to 4 times more than a conventional combine cycle plant • Hedge against fossil fuel pricing • Use of a natural indigenous resource • Promise of even lower pricing due to expected technology advancement of new technology not available with existing fossil technology
Groundbreaking of first CSP plant in the US since 1991- Red Rocks Arizona – March 24, 2004 Breaking news