Download
1 / 54
570 likes | 1.14k Vues
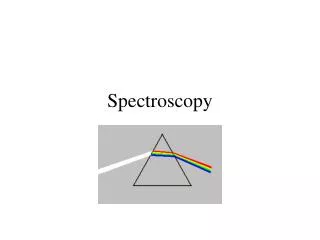
Spectroscopy Astronomers can learn an immense amount from the details of lines in the spectrum of light coming from planets and stars. This tool is used by chemists, biologists, physicists and all of the other natural sciences. It is based on the quantum or particle (photon) nature of light.

E N D
Spectroscopy Astronomers can learn an immense amount from the details of lines in the spectrum of light coming from planets and stars. This tool is used by chemists, biologists, physicists and all of the other natural sciences. It is based on the quantum or particle (photon) nature of light.
Spectral Lines • By the mid 19th century chemists noticed specific colors of light coming from particular gases. • Careful measurements indicated each element or compound produced a UNIQUE SET of EMISSION LINES:equivalent to FINGERPRINTS identifying the element . • Spectra of the SUN and other STARS showed emission at most frequencies, but distinct dark bands, or ABSORPTION LINES, were also detected.
Stellar and Chemical Spectra Introductory Spectroscopy Applet
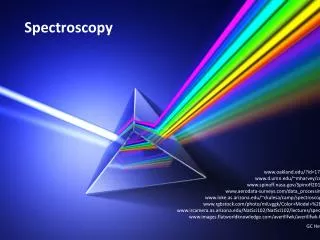
What are the three basic types of spectra? Continuous Spectrum Emission Line Spectrum Absorption Line Spectrum Spectra of astrophysical objects are usually combinations of these three basic types: how they arise is described by Gustav Kirchhof’s Laws.
Continuous Spectrum • Example: The spectrum of a common (incandescent) light bulb spans all visible wavelengths, without interruption.(star’s interior) • A hot solid, liquid or dense gas produces a continuous thermal spectrum (Kirchhof’s 1st Law)
Emission Line Spectrum • A thin or low-density cloud of gas emits light only at specific wavelengths that depend on its composition and temperature, producing a spectrum with bright emission lines (Kirchhof’s 2nd Law).
Absorption Line Spectrum • A cloud of gas between us and a light bulb can absorb light of specific wavelengths, leaving dark absorption lines in the spectrum: Kirchhof’s 3rd Law • Kirchoff's Laws Applet: Viewing Continuum and Lines
What kind of spectrum does a hot solid produce? • Emission (bright lines) • Absorption (dark lines) • Continuous (all the colors of the rainbow) • Infrared • Ultraviolet
What kind of spectrum does a hot solid produce? • Emission (bright lines) • Absorption (dark lines) • Continuous (all the colors of the rainbow) • Infrared • Ultraviolet
By looking at the light of a hot, solid object, you can tell: • Its temperature • What it is made of • Both 1 and 2 • Neither 1 nor 2, without some additional information
By looking at the light of a hot, solid object, you can tell: • Its temperature • What it is made of • Both 1 and 2 • Neither 1 nor 2, without some additional information
Origin of Spectral Lines • Those in the radio, mm, IR, visible, UV and most X-ray are due to QUANTUM TRANSITIONS BY ELECTRONS IN ATOMS and MOLECULES (Gamma-rays usually come from quantum transitions in the nuclei of atoms.) • ABSORPTION LINES ARISE FROM PHOTONS BEING ABSORBED BY ATOMS AND EXCITING ELECTRONS TO HIGHER LEVELS. • EMISSION LINES ARISE FROM ELECTRONS DROPPING DOWN TO LOWER ENERGY LEVELS, EMITTING PHOTONS.
Atomic Structure Helium: 2 p + 2 n Nuclei -- protons and neutrons with essentially all the mass of the atom. Electrons are in orbitals which define atomic energy levels-- essentially fill the volume. Carbon: 6 p + 6 n
Atomic Energy Levels “Classical” model -- not a very good approximation Probabalistic electron cloud-- wave function
Energy Level Transitions • The only allowed changes in energy are those corresponding to a transition between energy levels (here, Hydrogen) • Atomic Energy Levels Not Allowed Allowed
Energy is Conserved in Atomic Transitions • E2 - E1 = hf • Is the equation of CONSERVATION OF ENERGY FOR PHOTO-EXCITATION or PHOTOABSORPTION. • In denser gases frequent collisions between atoms shift observed wavelengths (Doppler effect) and smear out (broaden) the lines. • Once the density is high enough, the spectral lines blur into a CONTINUOUS SPECTRUM.
Exciting Atoms • ELECTRONS can be EXCITED THROUGH: either • PHOTO-EXCITATION (PHOTO-ABSORPTION), or • COLLISIONAL EXCITATION (atom collides with another atom or electron) • Here conservation of energy can be expressed as: E1 + KE1 = E2 + KE2, with E the electronic potential energy of the atom and KE the kinetic energy of the colliding atom or electron.
De-exciting Atoms • SPONTANEOUS (PHOTO-DE-EXCITATION) or PHOTO-EMISSION; • COLLISIONAL DE-EXCITATION (no photon out); • STIMULATED PHOTOEMISSION, really requires 3 energy levels: a photon “reminds” an electron to drop to the middle level after another source of energy pumped many electrons the high level • amplifying the original photon via a “chain reaction”: these photons are in phase, or COHERENT (via constructive interference) yields LASERS and MASERS. • Light [or Microwave] Amplification through Stimulated Emission of Radiation
Peer Instruction Question:What can cause an electron to jump from a low-energy orbital to a higher-energy one? • A photon of light is emitted • A photon of light is absorbed • The atom collides with an electron • Both 2 and 3 • Both 1 and 3
What can cause an electron to jump from a low-energy orbital to a higher-energy one? • A photon of light is emitted • A photon of light is absorbed • The atom collides with an electron • Both 2 and 3 • Both 1 and 3
Results of First Exam • Mean before curve: 55.32 • Curve: +19 • Mean after curve: 74.32 • Standard deviation: 11.54 • Distribution: • ≥90: 17 (high = 102) • ≥80: 15 • ≥70: 34 • ≥60: 22 • <60: 15 (low=50; <49 = random guessing: 0)
Most Difficult Questions • A6=C3: False, sidereal day=23h 56m 4s • A15=C10: False, p=1/d=1/50=0.02” NOT 0.05 • A21=C18: B: 1 AU = 1.5x10⁸km=1.5x1013cm • A25=C29: B: midnight, 4 min earlier/day =1 hr earlier/2 weeks = 3 hours earlier in 6 weeks • A34=C38: C: F=GM1M2/d2 so if d=0.25 AU then 1/d2=16 times as much • A37=C41: Newton didn’t determine distance between earth and sun; he did everything else
Rest of Most Difficult Questions • A39=C32: D, 20.00 AU because b2=a2(1-e2) so b = a(1-e2)1/2 = 30.00 (1-[51/2/3]2)1/2 b=30.00 (1-5/9)1/2=30.00(4/9)1/2=30.00(2/3) • A41=C34: B: 5.6km/s because • VY/VE=(2GMY/RY)1/2 / (2GME/RE)1/2 • VY/VE=(MY/ME)1/2 / (RY/RE)1/2 = (2/8)1/2=1/2 • So VY=VE/2=11.2 km/s / 2 = 5.6 km/s
Spectral Lines: Sodium Emission and absorption lines from Na gas; Yellow Doublet (two nearby wavelengths)
Atomic Transitions: Hydrogen • Lyman series involve transitions to the ground state (all UV lines) • Balmer series involve transitions to first excited state (visible and UV)
We should not expect to see an optical emission line spectrum from a very cold cloud of hydrogen gas because • Hydrogen gas does not have any optical emission lines. • The gas is too cold for collisions to bump electrons up from the ground state (lowest energy level). • Hydrogen gas is transparent to optical light. • Emission lines are only found in hot objects. • Cold objects only produce absorption lines.
We should not expect to see an optical emission line spectrum from a very cold cloud of hydrogen gas because • Hydrogen gas does not have any optical emission lines. • The gas is too cold for collisions to bump electrons up from the ground state (lowest energy level). • Hydrogen gas is transparent to optical light. • Emission lines are only found in hot objects. • Cold objects only produce absorption lines.
Chemical Fingerprints • Because those atoms can absorb photons with those same energies, upward transitions produce a pattern of absorption lines at the same wavelengths
Molecular Lines Hydrogen spectra: on top, molecular: H2 On bottom: simpler atomic: H
Molecular Transitions • In molecules there are many more possible quantum states, so many more spectral lines • Vibrational and rotational energy levels involve lower energies (longer wavelengths)
Doppler Effect • An observed wavelength or frequency will differ from the emitted one if there is a relative motion between the emitter and the observer. • RECESSION the OBSERVED IS LONGER, • or FREQUENCY IS LOWER --- REDSHIFT • APPROACH the OBSERVED IS SHORTER, • or FREQUENCY IS HIGHER --- BLUESHIFT
Doppler Shift Illustration Cause of Doppler Effect
Measuring the Shift Stationary • We generally measure the Doppler Effect from shifts in the wavelengths of spectral lines • Doppler effect for light Moving Away Away Faster Moving Toward Toward Faster
Doppler shift tells us ONLY about the part of an object’s motion toward or away from us: Star Motion Doppler Applet
Doppler Shift Formula • Ex: em =400.000 nm, obs=400.005 nm • What is the velocity of the star? • = 400.005 nm - 400.000 nm = 0.005 nm • So, v = c (/ ) = 3.0x10⁵ km/s (0.005 nm/400nm) = 3.0x10⁵ km/s (1.25x10⁻⁵) = 3.75 km/s • Or the star is moving 3.8 km/s AWAY from us. • Doppler shifts and velocities • We can much more easily HEAR the Doppler effect than SEE it. WHY?
Sound Speed vs Light Speed • The speed of sound in air is a little more than 300 m/s (or 1000 ft/s) while the speed of light in air is 300,000,000 m/s or nearly 1,000,000 times more! • A car traveling 62 mph (or 100 km/h) is moving roughly 30 m/s (really 27.8 m/s) or a little less than 10% of the speed of sound. • You can hear a pitch change of 10% very easily. • But the same car is traveling less than 10-7 of the speed of light -- that shift of a 500 nm visible spectral line would be only 0.00005 nm -- • way too small to see and extraordinarily hard to measure: only a few instrumentsaround the world can do this; they are used to find planets around OTHER stars.
Can the Doppler shift be measured with invisible light? • No • Yes
Can the Doppler shift be measured with invisible light? • No • Yes, That’s how you get a speeding ticket–police use radar (microwaves) to measure your car’s Doppler shift.
Thunder and Lightning • You see lightning; the thunderclap comes later. • Lightning is seen at the speed of light; • Thunder is heard at the speed of sound. • Since sound travels roughly 300 m/s or 1000 ft/s, if he sound arrives: • about 3 seconds later the bolt was about 1 km away; • 5 sec later, about a mile away; • 0 sec later -- you may be dead from a lightning strike!
If a distant galaxy has a substantial redshift (as viewed from our galaxy), then anyone living in that galaxy would see a substantial redshift in a spectrum of the Milky Way Galaxy. • Yes, and the redshifts would be the same. • Yes, but we would measure a higher redshift than they would. • Yes, but we would measure a lower redshift than they would. • No, they would not measure a redshift toward us. • No, they would measure a blueshift.
If a distant galaxy has a substantial redshift (as viewed from our galaxy), then anyone living in that galaxy would see a substantial redshift in a spectrum of the Milky Way Galaxy. • Yes, and the redshifts would be the same. • Yes, but we would measure a higher redshift than they would. • Yes, but we would measure a lower redshift than they would. • No, they would not measure a redshift toward us. • No, they would measure a blueshift.
Spectral Line Shapes • In reality, lines are not at exactly one frequency or wavelength • All lines have widths, shown here for an emission line. • Line shapes are an important tool in studying stars and gas in space
Thermal and Rotational Broadening • Higher pressure gas produces broader lines • Rotation produces broadening of a different shape: redshifts from receding side and blueshifts from approaching
Spectrometers • Most telescopes spend most of their time measuring spectra of stars, gas clouds and galaxies. WHY? • Spectra tell us: • Compositions: elements & molecules (line positions) • Temperatures (line strengths) • Abundances (line strengths) • Pressures (line widths: pressure broadening) • Radial velocities (Doppler shift) • Rotation (Doppler broadening) • Magnetic fields (Zeeman splitting) • And, indirectly, masses, ages, distances, sizes and MORE!
How do we interpret an actual spectrum? • By carefully studying the features in a spectrum, we can learn a great deal about the object that created it.
What is this object? Reflected Sunlight: Continuous spectrum of visible light is like the Sun’s except that some of the blue light has been absorbed - object must look red
What is this object? Thermal Radiation: Infrared spectrum peaks at a wavelength corresponding to a temperature of 225 K
What is this object? Carbon Dioxide: Absorption lines are the fingerprint of CO2 in the atmosphere