Download
1 / 35
370 likes | 627 Vues
Reactome Functional Interaction (FI) Network. Steve Jupe. Motivation for Pathway and Network Analysis in Cancer. “ Exclusivity principle ” in cancer. once a gene is mutated in a pathway, the selective growth advantage incurred by a second mutated gene in the same pathway is minimal.

E N D
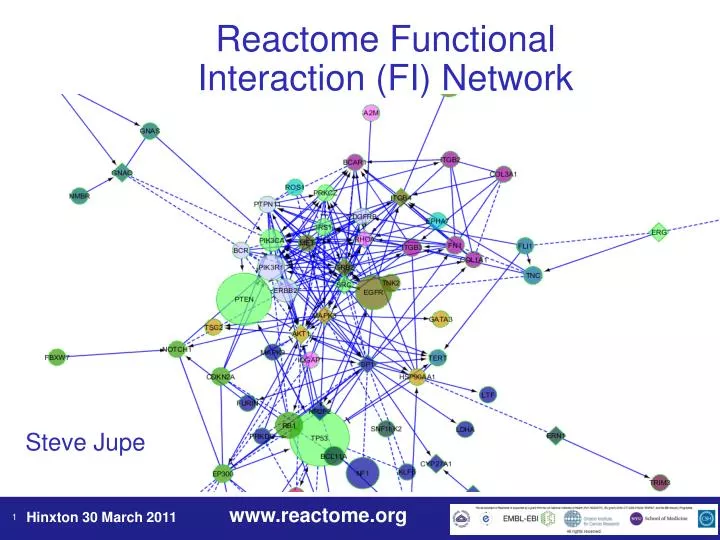
Reactome Functional Interaction (FI) Network Steve Jupe
Motivation for Pathway and Network Analysis in Cancer • “Exclusivity principle” in cancer. • once a gene is mutated in a pathway, the selective growth advantage incurred by a second mutated gene in the same pathway is minimal. • rare for a single tumor to have multiple genes altered in the same pathway. • Analyzing mutated genes in a pathway context. • reveals relationships among these genes. • facilitates hypothesis generation on roles of these genes in disease phenotype. • identifies genes on the affected pathways as therapeutic targets.
Analysis Workflow – Cancer Microarray Experiment: Gene expression profiling of pancreatic tumour (vs normal tissue). Output:list of genes that show significant changes in expression. Downstream analysis: • Validation of the top genes sorted by fold-change (or p-value): artificial cut-off, information loss; • Manual reviewing and gene classification based on literature, databases and own prior experience: time-consuming and bias; • GO annotation and pathway analysis (e.g. Reactome): what biological terms or functional categories are represented in the gene list more often than expected by chance; • Network-based analysis. - identify markers not as individual genes but as sub-networks extracted from protein interaction databases and the resulting sub-networks provide novel hypotheses for pathways involved in cancer.
What is the Functional Interaction Network? • A reliable interaction network based on manually curated pathways extended with verified interactions • Covers almost 50% of human Uniprot proteins • A resource for construction of FI sub-networks based on gene sets • Tools that: • Provide the underlying evidence for FIs • Build and analyze network modules of highly-interacting groups • Perform functional enrichment to annotate modules • Expand the network by finding genes related to the experimental data • display source pathway diagrams and overlay with a variety of information sources such as cancer gene index annotations. • Method and practical application: A human functional protein interaction network and its application to cancer data analysis, Wu et al. 2010 Genome Biology
Pairwise Problem • Convert reactions in pathways into pair-wise relationships • Functional Interaction: an interaction in which two proteins are involved in the same reaction as input, catalyst, activator and/or inhibitor, or as components in a complex Reaction Functional Interaction Input1-Input2, Input1-Catalyst, Input1-Activator, Input1- Inhibitor, Input2-Catalyst, Input2- Activator, Input2-Inhibtior, Catalyst-Activator, Catalyst- Inhibitor, Activator-Inhibitor
Construction of the Reactome FI Network Reactome Functional Interaction (FI) Network [15%] Wu et al. Genome Biology 2010
Coverage after Prediction • 10,956 proteins (9,542 genes) • 209,988 FIs • 5% of network shown here
Limitations of web FI overlay • Simple viewer – no extra tools • Not easy to produce networks • Not dynamic – you can’t move the pathway diagram objects
A FI Sub-Network Generated from Significant Network Modules based on a TCGA OV Expression Data Set
Cytoscape • Cytoscape - open source platform for visualizing complex-networks and integrating these with any type of attribute data. • Java-based • Plug-in development framework • First public release: July 2002, v0.8 • Current release: 2.8.1 • Website: http://www.cytoscape.org
Reactome FI Cytoscape Plug-In • Cytoscape v2.7.0 or later. • Reactome Homepage (see URL below) • Menu Bar -> Tools, FI Cytoscape Plugin • Save jar file caBigR3.jar into Cytoscape plugins folder, restart. • http://reactomedev.oicr.on.ca:8080/caBigR3WebApp/Cytoscape/plugins/caBigR3.jar • Also available as Java Web Start: Cytoscape.jnlp • http://reactomedev.oicr.on.ca:8080/caBigR3WebApp/Cytoscape/Cytoscape.jnlp
FI Network Analysis Pipeline Select gene list (mutated, over-expressed, down-regulated, amplified or deleted genes) Project genes of interest onto Reactome F.I. Network Identify Disease/Cancer Subnetwork Apply Clustering Algorithms Apply Pathway/GO Annotation to each cluster Generate Biological Hypothesis! Predict Disease Gene Function Classify Patients & Samples T2D OvCa GBM Breast Prostate TCGA ICGC
Using the Reactome FIs Plug-in • Choose Plugins, Reactome FIs. • FI plug-in supports three file formats: • Simple gene set: one line per gene. • Gene/sample number pair. Contains two required columns, gene and number of samples having gene mutated, and an optional third column listing sample names (delimited by semi-colon ;). • NCI MAF (mutation annotation file).
File Formats NCI MAF (mutation annotation file) Gene/Sample Number Pairs Simple Gene List MSI2 PTPRT PELO SLC18A1 TACC2 FAM148B PRC1 MSTN ATP6V1G2 APOE IMPA2 AGER XPO5 MEST RREB1 BAT1 WIPI1 CATSPERB SSR1 VEGFA EGFL8
Loading a file • Choose file • Choose file format and parameters • Click OK
Results Display • Constructed network is displayed in the Network View panel using an FI specific visual style
Pop-up menu • Right-click an empty space in the network view panel.
Fetch FI annotations • Details information on selected FIs. Three edge attributes are created: FI Annotation, FI Direction, and FI Score. Edges display direction attribute values. • --> for activating/catalyzing • --| for inhibition • solid line for complexes or inputs • --- for predicted FIs. • VizMapper tab, Edge Source Arrow Shape and Edge Target Arrow Shape values give details.
Analyze network functions • Pathway or GO term enrichment analysis for the displayed network. • Use Data Panel to: • Filter enrichment results by FDR value. • Check “Hide nodes in not selected rows” to display only nodes in the selected row or rows • To analyze an unlinked set of genes choose the "Show genes not linked to others" option when importing data
Cluster FI network • Runs spectral partition based network clustering (Newman, 2006) on the displayed FI network. • Nodes in different network modules will be shown in different colours (max 15 colours).
Analyze module functions • Pathway or GO term enrichment analysis on individual network modules. • Use filter to remove small network modules • Filter by FDR • Button selects nodes in the network corresponding to selected row or rows in the Data Panel.
Other features - Query FI source • Right-click edge, select "Reactome FI/Query FI Source". • If the FI was extracted from a curated pathway the original data source(s) is displayed • Double click a row in the table to show details • If the FI is predicted the evidence is displayed.
Other features - Fetch FIs for node • Select node in the network panel, right click for pop-up menu, select "Reactome FI, Fetch FIs" • FI partners for the selected node are displayed in two sections: Partners that are displayed and partners that are not displayed. • Select undisplayed partners and click Add
Other features - Show pathway diagram (KEGG) • Select a pathway in "Pathways in Network/Modules" tabs, right click, select "Show Pathway Diagram” • KEGG pathways - diagram page is opened. Nodes listed in "Nodes" column are highlighted in red.
Other features - Show pathway diagram (Reactome) • Reactome pathway diagrams open in a separate window. • For human data the manually drawn pathway diagram is displayed. • For other species an automated layout is generated. • Nodes in the Cytoscape network are highlighted in blue on the diagram • Detailed information is viewed using a pop-up menu item "View Instance". • Zoom slider bottom of the window. • Overview window top-right corner
Cancer Gene Index annotations • Cancer Gene Index annotations can be added in two ways: • popup menu "Load Cancer Gene Index" when no object is selected (left) • popup menu "Fetch Cancer Gene Index" for a selected node (right)
Load Cancer Gene Index • This method loads the tree of NCI disease terms in the left panel. • Select a disease term in the tree to select all diagram objects that have this annotation or one of its sub-terms.
Fetch Cancer Gene Index • This method is for viewing detailed annotations for the selected gene or protein. • Annotations are sortable by PubMed ID, Cancer type, status, and several other criteria.
Cancer Gene Survival Analysis • Based on a server-side R script that runs either coxph or Kaplan-Meyer survival analysis. • Requires appropriate data file (see online). • Popup menu “Analyze Module Functions, Survival Analysis...” • Results are displayed with a tab "Survival Analysis" (right). • You can display multiple analyses. • Only Kaplan-Meyer analysis will show a plot file. You can click the file to view the actual plot (far right).
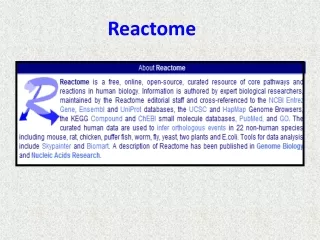
Summary • Reactome is a highly reliable, human-curated database of biological pathways and reactions. • Expanded the human curated Reactome pathways by importing pathways from other databases and integrating predicted FIs: ~50% coverage. • Functional interaction network provides a powerful way to visualize cancer and other disease genes to reveal functional relationships among these genes.
Future • Implement multiple network clustering algorithms • Currently spectral partition only • Future: edge-betweenness, MCL, and hierarchical clustering • Integrate with other data types: gene expressions, CNVs… • Seamless integration with Reactome pathway diagrams • Expand known cancer pathways by using FIs • Integrate miRNA/target interactions to study miRNA activities on cancers