Download
1 / 45
450 likes | 588 Vues
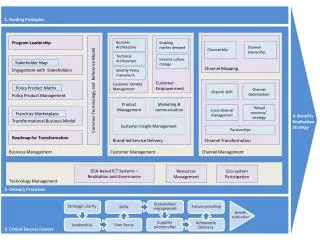
The Guiding Principles, Realities and Future of Cloud Resolving NWP Models. by G. J. Tripoli The University of Wisconsin - Madison. Synoptic Paradigm. (1903) V. Bjerknes Use natural laws to predict Weather (1922) L. F. Richardson Weather Prediction is an initial value problem

E N D
The Guiding Principles, Realities and Future of Cloud Resolving NWP Models by G. J. Tripoli The University of Wisconsin - Madison
Synoptic Paradigm • (1903) V. Bjerknes Use natural laws to predict Weather • (1922) L. F. Richardson Weather Prediction is an initial value problem • (1950) Charney performs 1st NWP integration • (1961) Lorenz shows that there are limits to predictability
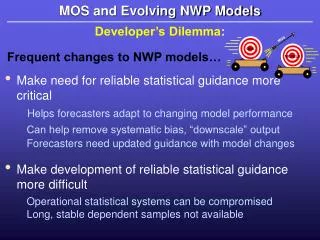
The last 50 years • We developed climate models, GCMs, weather prediction models, cloud models, LES models and more • We developed multivariate analysis schemes that evolved into data assimilation systems • Physics representation has steadily improved • Resolution increasing with Moores Law • Weather forecasts have generally improved
But.. • There has been a troubling problem with the “QPF” and “Warm Season” prediction in particular, it just hasn’t been improving as much. • The tropical cyclone problem is similar in that improvement of intensity prediction error is slow or nonexistent • What do these two problems have in common? • Energy driving system evolution moving upscale from below where it is poorly resolved and poorly observed • Previous synoptic analysis and NWP has never had sufficient resolution before now to represent such scale interaction
Hurricane Forecast Problem Track forecast skill is steadily improving while intensity prediction skill is showing little improvement…Why?
20th Century Paradigm for NWP • Deterministic Prediction of Subordinate Disturbances • Initialize model with deterministic “synoptic scale” flow • Predict mesoscale features created by the interaction of predictable features with definable surface characteristics • Mesoscale features take on the predictability of the synoptic scale flow
20th Century Paradigm for NWP • Simulation of Subordinate Disturbances • Initialize model with deterministic flow • Predict mesoscale features created by the interaction of predictable features with definable surface characteristics • Simulated mesoscale features have independent behavior, but may be used to explain the behavior of simulated phenomena
Hurricane Forecast Improvement Project • How can we move forward with tropical cyclone intensity prediction? • Can implementing high resolution forecast systems, utilizing the most powerful computers lead to the break throughs that we need?
The High Resolution Test • Hypothesis: • Given an initial condition of the hurricane vortex defined at 9 km resolution then • Decreasing the horizontal numerical model grid spacing from 9 km to 1 km, will result in a significant increase in the skill of intensity forecasts in the 5 day time frame • The dependence of intensity forecast accuracy on resolution is a robust property of all numerical models
The Test • Control model will be the GFDL hurricane model having nesting resolutions: • Coarse Grid 1: • ~ 75 latitude x 75 longitude degrees (8000 x 8000 km) • Delta x = Delta y ~ 9 km (1/12 degree) • Medium Grid 2: • ~ 9 latitude x 9 longitude degrees latitude (1000 x 1000 km) • Delta x = Delta y ~ 3 km (1/36 degree) • Fine Grid 3: • ~ 3 latitude x 3 longitude degrees (330 x 330 km) • Delta x = Delta y ~ =1 km (1/108 degree)
The Test • Test impact of resolution by 3 part tests for each case: • 5 day forecast, Grid 1 only • 5 day forecast, Grids 1 and 2 only • 5 day forecast, Grids 1, 2 and 3 • Hypothesis verified if: • significant improvement in track and intensity going from a to b and from b to c • Similar improvements for each model tested
Modeling Groups • U. Rhode Island - GFDL Hurricane Model (I. Ginis/ M. Bender) • OperationalNOAA hurricane model hydrostatic, compressible, sigma vertical coordinate • GFDL initial vortex (bogused with guidance from reconnaissance) • AOML- HWRF-X (S. Gopalakrishnan) • Research hurricane model nonhydrostatic, compressible, sigma vertical coordinate • Adapted WRF model • GFDL initial vortex • NCAR/MMM- AHWRF (C. Davis/ R. Torn) • Researchhurricane model nonhydrostatic, compressible, sigma vertical coordinate • EnKF data assimilation initial vortex • PSU - WRF-ARW (F. Zhang) • Research mesoscale model nonhydrostatic, compressible, sigma vertical coordinate • EnKF data assimilation initial vortex • NRL - COAMPS - TC (M. Peng/ R. Hodur) • OperationalNAVY TC nonhydrostatic model, quasi-compressible, sigmaz vertical coordinate • Initial vortex relocated from previous 12 hour forecast • U. Wisconsin - NMS - (W.Lewis/ G. Tripoli) • Research mesoscale model; nonhydrostatic Lamb Vector form, quasi-compressible, vertical height coordinate with VST • Uniquely constrained dynamics core • GFDL initial vortex
Evaluation • Track Error (nm) vs lead time • Intensity Error (kt) vs lead time • Absolute Intensity Error (kt) vs lead time • Wind radii error (nm) (34,50, 64 kt) SS improvement • Rapid Intensification and Rapid Weakening using event and episode methodologies SS improvement with resolution? • Consistency --subjective inspection or 10 difference measurements • Overall evaluation
Final Conclusions of HRH Test • Results are suggesting that the hypothesis is NOT verified! • Less than significant and less than robust improvements found. • In a few cases, increased resolution led to degraded results • No apparent increase in skill for those employing 4DVAR (NRL) or EnKF (PSU, MMM) data assimilation systems
Bottom Line THE SYNOPTIC PARADIGM HAS HIT THE WALL
5 Dimensional Gap between conventional “synoptic” observations and model resolution
Can we overcome the gap? • “we can just fill it with satellite data?” • “ we just need more satellite resolution to match the model scales, right?” • Or is the existence of a simple resolution gap “problem” really just good old time “synoptic” thinking?
Filling the Gap • The only option to fill this continually widening gap is through remote sensing, i.e. satellite, radar, lidar, E-M signals, specialized aircraft • But remotely sensed weather analysis is indirect, under-specified and dependent on models to make a connection with state measurement.
Predictability Issues in Age of Cloud Resolving Models • Deterministic predictability is practically confined to time scales less than 1 lifecycle period of the energy containing disturbance, i.e. linear time scales • NWP successes • Baroclinic Cyclone ~ 6 - 7 days (classic synoptic problem) • Things we have trouble with • Eye Wall ~ 20 - 40 hours • Rainband, MCS ~ 4-20 hours • Cumulus cloud ~ 20 - 60 minutes • Perhaps probabilistic predictability of certain small space-time scale features can be attained from the predictability of their sustaining environment • Most typically, this will be the slow manifold, balanced portion of the flow field…but not always
Can we initialize cloud scales with Cloud Resolving Data? • How much data resolution does it take to define a feature? • Dependent on spatial scales • Dependent on time scales • We were raised with the “synoptic” paradigm, but recall the classic “synoptic” disturbance has a lifecycle of 6-7 days. • It is no accident that we typically take 3D observations 1-2 times a day, because that is about 6-12 observations pre lifecycle…of the “synoptic” wave with which we have had some success with prediction • Most of us who have worked with numerical systems know the 2nd order numerical representation of a simple sine wave yields 9% phase error when represented by 10 points, 28% error when sampled by 5 points and 100% error when sampled by 2 points!
The Space-Time Problem • We have had success with the “synoptic” paradigm until now because • multivariate observations have adequately defined the “synoptic” problem in both space and time. • The problems that we are encountering in NWP are because resolved model scales have become smaller than the power of our observing systems to resolve those scales in space-time • We must build observation systems to optimally equip our prediction systems with observations having space-time resolution comparable to those resolved by the models
How can we move forward? • Remote sensing based data assimilation the only option • Goals of data collection and modeling must be modified to reflect the new S-T paradigm, i.e. optimizing S-T resolution to fit that of the model • Multivariate needed to define relationship between dynamics and thermodynamics • To define these entities, we need a minimum of 6-10 observations per S-T dimension • Models must ultimately merge with data collection to: • Form a probabilistic analysis , such as an ensemble analysis • The optimal analysis must select the S-T model physics and evolution at space and time scales that support the observed behavior of radiance over time.
Expectations and Goals • Expectations should be for: • probabilistic forecasts, where uncertainty becomes an expected and necessary part of a forecast. • Deterministic forecast is a special case • Deterministic forecast probably only possible over time scales less than one lifecycle - ( 20 minutes for convective plume) • The goal of NWP should not be for a most likely atmospheric state, but for a range of possibilities articulated in a standardized probabilistic format
Why can’t space time be predicted as an Initial Value Problem? • Initial state contains all of the information necessary for a nonlinear forward prediction (hollographic principle of NWP) • To access this information, infinite multivariate spatial resolution necessary • Otherwise, to predict linear progression of a truncated space-time analysis we need to define the space-time structure to filter the space-time structures that are not resolved from the initial condition
We need to define or initial state with matching Space-Time fidelity • Requires high spatial AND temporal scale resolution • Requires multivariate definition • Doppler radar is one such observation system that fills this need for smor of the convective scale features that we now resolve • Geostationary passive satellite observations are the best option we have today from space, although they only view 2 spatial dimensions in the convective areas
Observation Options • High frequency Doppler radar observations are the only feasible technology to fill the data gap in cloudy regions • Reconnaissance aircraft based Doppler radar has been demonstrated to improve space-time definition, but: • is not available for all disturbances affecting a TC genesis • Is not available continuously throughout the lifecycle of the TC • expensive limited deployments affordable only by a few societies • UAVs may work, but it would take a lot of expensive UAVs to define cloud structures across an ocean basin and without defining the structures outside as well as within the TC, analysis would be incomplete
NEXRAD assimilation Zhang et al., 2009
Future Observations • GeoSTAR- Microwave in geostationary orbit • Very important advance in helping resolve the time dimension, but • Vertical dimension still not observed • No direct independent multivariate observation, requiring assumptions of balance to assimilate dynamics
Future Observation Option • High frequency three-dimensional Doppler radar observations taken by satellite in geostationary orbit would be the only option featuring space-time multivariate resolution that can fill the data gap over the remote regions of TC and convective system genesis • Such an observational platform, named “NEXRAD in Space” has been under development at NASA for nearly a decade and is now reaching a stage where an experimental launch could be made within a decade
NEXRAD in SPACE Scan Area (200 m vertical resolution, 55 degrees diameter)
ESTO Advanced Technology Progarm (ACT-2008) A Large Deployable Reflector for Ka- and W-band Remote Sensing PI: Houfei Fang, JPL Objective • Develop a large, high frequency and high gain deployable reflector technology to enhance the Aerosol, Clouds and Ecosystem (ACE) Mission and enable the Nexrad-In-Space (NIS) mission. • This will be implemented by leveraging and integrating several recently developed material technologies, including Shape Memory Polymer (SMP) material; high-precision Membrane Shell Reflector Segment (MSRS) casting process; near zero CTE (coefficient of thermal expansion) membrane NovastratTM; and Poly-Vinylidene Floride (PVDF) electro-active membrane. • This technology offers precision an order of magnitude higher than the currently used tensioning cable truss reflector and provides a desirable surface contour. Architecture: a deployable SMP tetrahedral truss supports a set of MSRS to form a high definition, smooth and continuous surface An optical quality PVDF film deforms from a flat shape to a concave shape with the application of voltage Approach Key Milestones • Develop Shape Memory Polymer tetrahedral truss • Develop Membrane Shell Reflector Segment • Integrate a 1.5-m subscale prototype • Conduct tests for the 1.5-m prototype • Analytically scale-up from 1.5-m to 5-m for ACE application, and to 35-m for NIS application • Complete structure concept 09/09 • Complete MSRS design and optimization 06/10 • Complete structure prototype design 06/10 • Complete structure component developing 12/10 • Complete MSRS manufacturing technology 12/10 • Complete subscale prototype integration 06/11 • Complete subscale prototype testing 09/11 • Complete scale-up and final report 12/11 Co-Is/Partners: Simone Tanelli, Mark Thomson, JPL; James Moore, NeXolve Corporation; John Lin, ILC Dover TRLin = 2 TRLcurrent = 2 04/10
ESTO Advanced Technology Program (ACT-2005) High-Precision Adaptive Control of Large Antenna Surface PI: Houfei Fang, JPL Objective • Develop a high precision adaptive surface figure control system to correct for the surface distortions in large deployable membrane antennas, enabling earth remote sensing from higher (Geostationary and Medium) earth orbits and with improved resolution • The architecture is based on state-of-the-art technologies in Flexible PVDF (Poly-Vinylidene Floride) Copolymer Film (FPCF) actuators, wavefront sensing metrology, and active shape control laws. • Enable high-resolution monitoring of rapidly changing environments, such as hurricanes and severe storms, from a geostationary orbiting radar The 2.4-m diameter prototype model. It consists of an inflatable membrane reflector, 84 single and 84 double actuators, flexible circuits, and photogrammetry targets. Accomplishments • Assessed the performance of optical wavefront sensing-based and laser-based metrology technologies. • Characterized the performance of several membrane materials for space antenna application and fabrication scalability. • Developed PVDF actuator fabrication process and fabricated 372 actuators for the prototype antenna. • Prototyped a 2.4-m-diameter membrane antenna and installed 168 actuators for controlling the surface contour. • Developed an Influence Coefficient Matrix-based model for regulating the input voltages to actuators for antenna surface correction. • Conducted initial surface actuation test on the 2.4-m antenna prototype and the test results were well-correlated with the model predictions. • Scaled the experimentally verified model to the design of a 35-m-diameter antenna surface contour control system. Co-Is/Partners: Xian An, Ubaldo Quijano, JPL; Kon-Well Wang, Jeff Hill, University of Michigan; Frank Djuth, Geospace Research; James Moore, James Pearson, ManTech SRS Technologies TRLin = 2 TRLout = 4 05/09
NIS as an observational tool Lewis et al. (2010) simulate NIS observations for Hurricane Wilma (2005) using a UW-NMS high-resolution simulation. Assessment of structure reconstructed from VR and Ze observations Retrieval of relevant (i.e. operationally interesting) metrics
Retrieval of VH If we assume VH >> w , then the horizontal wind may be retrieved in terms of the measured (here, assumed dealiased) Doppler radial velocity: where and d is the range to the target and a is the earth’s radius. VH= |VR | / (cos2θ sin2γ + sin2θ cos2γ)1/2. θ = α + sin-1 [(d sin α)/a] γ = β + sin-1 [(d sin β)/a].
Ze (X band) TRUTH VH Reflectivity and Winds (4.5 km AGL) Ze (Ka-band) NIS VH
Horizontal Wind Cross Section TRUTH NIS RETRIEVAL
Max Wind and Wind Radii (TRUTH, NIS RETRIEVAL) Vmax RMSE = 7 ms-1 (before ERC) = 3.7 ms-1 (after ERC) Vmax R64 RMSE = 16 km R64 RMW RMSE = 6.4 km RMW
Conclusions • To realize the potential for predictability of TC intensity and track, as well as the “summertime prediction problem”: • Understand the numerical and physical limitations of predictability relative to the space-time scales driving the system evolution • Develop observational strategies to define the space-time multivariate structures driving storm evolution • Embrace and support the development of future Geo 3D multivariate observation technologies (NIS, multi spectral, Doppler lidar, etc) because they represent the only practical hope of filing the 5D data gap that continues to widen as models achieve higher resolution