Download
1 / 28
300 likes | 332 Vues
Overlay. A series of registered data layers ‘overlaying’ each other. Arguably the most important GIS analysis function. Overlay. Derived from manual cartographic overlay using Mylar sheets (transparent plastic) that were physically overlaid on top of one another.

E N D
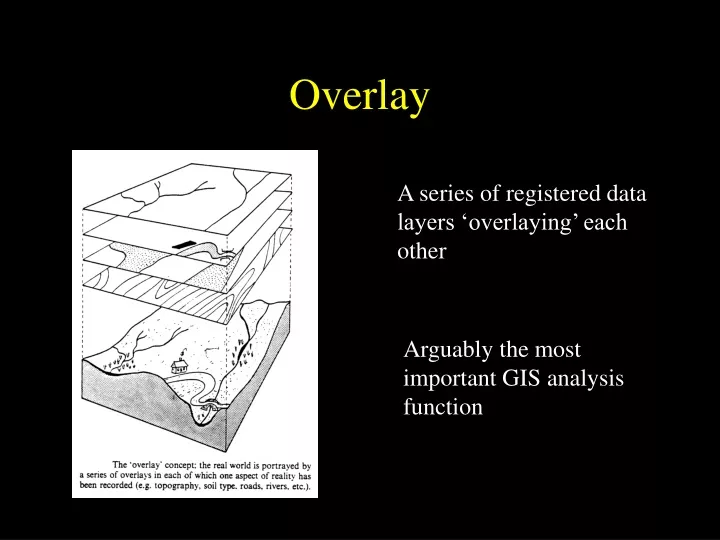
Overlay A series of registered data layers ‘overlaying’ each other Arguably the most important GIS analysis function
Overlay Derived from manual cartographic overlay using Mylar sheets (transparent plastic) that were physically overlaid on top of one another. -Ian McHarg in landscape architecture at University of PA
Overlay • An overlay operation takes two or more data layers as input and results in an output data layer • Three types of overlay • Point in polygon • Line in polygon • Polygon on polygon • More complex in vector than in raster
Overlay • Raster overlay • layers are registered • layers have same resolution
2 0 2 2 0 2 0 2 2 0 0 0 0 0 0 2 0 2 0 2 2 2 2 0 0 0 0 0 1 1 2 0 2 1 3 2 2 2 0 0 0 0 0 0 0 0 0 0 2 2 0 2 0 2 3 1 2 2 0 2 1 1 0 0 0 0 2 0 2 3 1 2 2 2 0 Overlay • Point in polygon: raster • Where are there trees in the urban area? ‘Point’ ‘Polygon’ Result + = 0 - not urban, no tree 1 - not urban, tree 2 - urban, no tree 3 - urban, tree 0 - not a tree 1 - tree 0 - not urban 2 - urban
2 0 0 2 0 2 0 0 0 0 0 2 2 0 0 2 0 0 1 0 0 2 3 1 0 2 0 0 0 0 0 0 0 2 2 0 3 1 0 2 0 1 0 0 0 2 3 1 2 0 Overlay • Point in polygon: raster • Where are there trees in the urban area? reclassify < 3 = 0 3 = 1 0 - not urban, no tree 1 - not urban, tree 2 - urban, no tree 3 - urban, tree 0 - not an urban tree 1 - urban tree
0 2 2 2 1 3 2 2 0 0 0 0 0 0 0 2 0 2 2 1 3 2 0 2 0 0 0 0 0 0 3 1 2 2 1 3 3 2 1 1 0 1 1 1 0 0 0 0 3 2 1 2 0 2 0 2 2 2 2 0 0 0 0 1 1 0 0 2 2 0 2 2 2 0 2 Overlay • Line in polygon: raster • Where are there roads in the urban area? ‘Line’ ‘Polygon’ Result + = 0 - not urban, no road 1 - not urban, road 2 - urban, no road 3 - urban, road 0 - not a road 1 - road 0 - not urban 2 - urban
Overlay • Point in polygon: vector • Jacobsen plumbline algorithm Pass a line through the point and polygon if number of line/polygon intersections is: even - point is outside odd - point is inside
Overlay • Point in polygon: vector • result must include attribute information Input Input Output 1 2 A A C + = C B B Point Table Poly Table Point Table ID Cover 1 Rural 2 Urban ID Tree A Elm B Maple C Elm ID Tree Cover A Elm Rural B Maple Rural C Elm Urban
Overlay Input Input Output • Line in polygon: vector • result must include attribute information C C A A + = D B B 1 2 1 2 Point Table Poly Table Point Table ID Cover 1 Rural 2 Urban ID Street A Race B Race C Arch ID Street Cover A Race Rural B Race Urban C Arch Urban D Race Urban
Overlay • Raster overlay • Boolean combination
0 0 1 1 0 0 0 0 1 0 0 1 0 1 0 0 1 0 0 1 0 1 0 0 0 0 1 0 0 0 0 0 0 0 0 0 0 0 0 0 0 0 0 0 0 0 0 1 0 0 1 0 1 0 1 1 1 1 1 1 0 0 1 1 0 0 1 0 0 1 1 1 1 1 1 Overlay • Raster overlay: polygon on polygon • where is agriculture on poor quality soil? Agr and poor soil Agriculture Poor soil quality
Overlay • Raster overlay
1 0 1 0 0 1 0 0 0 0 0 1 0 1 1 0 0 0 0 1 1 1 1 1 1 1 0 1 0 1 2 2 2 2 2 1 2 0 0 2 2 2 2 2 2 1 0 2 0 2 Overlay • Raster overlay: polygon on polygon • where is agriculture on poor quality soil? Land cover Soil quality Output agriculture + poor = 2 forest + fair = 2 residential + good = 2 + = 0 - residential 1 - forest 2 - agriculture 0 - poor 1 - fair 2 - good
0 1 0 1 0 1 0 0 0 0 1 0 1 0 1 0 0 0 0 0 0 1 0 1 0 1 0 0 0 0 2 1 1 2 1 2 2 1 2 1 2 1 2 1 1 2 1 2 2 1 Overlay • Raster overlay: polygon on polygon • where is agriculture on poor quality soil? Land cover Agriculture reclassify 0 - residential 1 - forest 2 - agriculture 0 - not agriculture 1 - agriculture
0 1 1 0 0 1 0 1 1 0 0 1 0 1 0 1 0 1 0 1 1 0 0 1 1 0 1 0 0 1 0 2 0 2 1 0 0 1 0 1 0 2 0 2 1 0 1 0 0 1 Overlay • Raster overlay: polygon on polygon • where is agriculture on poor quality soil? Soil quality Poor soil quality reclassify 0 - poor 1 - fair 2 - good 0 - not poor 1 - poor
Overlay 1 1 0 1 0 1 1 0 1 0 1 1 1 1 0 1 1 0 0 1 1 1 1 0 1 1 0 0 0 0 0 0 0 0 0 0 0 0 0 0 0 0 0 0 0 0 1 1 0 1 1 1 1 0 1 2 1 1 2 1 1 0 1 1 0 1 1 0 1 1 1 2 2 1 1 • Raster overlay: polygon on polygon • where is agriculture on poor quality soil? Output Agriculture Poor soil quality + = 0 - not agr., not poor 1 - agr., not poor or not agr, poor 2 - agr, poor 0 - not agriculture 1 - agriculture 0 - not poor 1 - poor
Overlay 0 1 1 0 0 1 0 1 1 0 0 1 1 0 1 0 1 0 0 0 0 0 0 0 0 0 0 0 0 0 1 0 0 1 0 1 2 1 2 1 0 1 0 1 0 1 1 2 2 1 • Raster overlay: polygon on polygon • where is agriculture on poor quality soil? Output Final Output reclassify 0 - not agr. on poor soil 1 - agr. on poor soil 0 - not agr., not poor 1 - agr., not poor or not agr, poor 2 - agr, poor
0 0 0 0 0 0 1 0 1 1 1 0 1 1 0 0 1 1 1 2 1 1 1 0 1 1 0 1 1 2 2 2 0 2 1 1 1 2 3 1 0 1 1 1 0 3 2 1 2 4 2 4 2 2 1 3 2 1 0 1 2 1 3 2 2 4 4 2 2 2 3 1 2 0 2 Overlay Daily high temperature Daily high humidity • Raster overlay: map algebra Hot + Humid Index + = 0 - very low 1 - low 2 - medium 3 - high 4 - very high 0 - mild 1 - warm 2 - hot 0 - not humid 1 - semi humid 2 - very humid
Overlay • Raster overlay: map algebra • can use addition, multiplication, etc. • can ‘weight’ certain data layers • can use any number of data layers • can’t use nominal data unless it used as inclusionary/exclusionary by reclassification! • Be careful with ordinal data - classification impacts the results of overlay! • Standardize interval/ratio data
Overlay • Vector topologic overlay: Boolean operators Intersection (and) Union (or) Identity
Overlay • Vector topologic overlay: intersection
Overlay • Vector topologic overlay: intersection (and) Agriculture Good Quality Soil Build new topology A A B B ID Owner A Brown B Smith ID Quality A good B good Area of intersection New node
Overlay Build new topology Output • Vector topologic overlay: intersection (or) A B ID Owner Quality A Brown good B Smith good Area of intersection New node
Overlay • Vector topologic overlay: union Agriculture Good Quality Soil Build new topology A A B B ID Owner A Brown B Smith ID Quality A good B good Area of union New node
Overlay Output Build new topology • Vector topologic overlay: union B C A D E ID Owner Quality A good B Brown good C Brown D Smith E Smith good Area of union New node
Vector topologic overlay: identity Agriculture (input layer) Good Quality Soil (identity layer) Build new topology A A B B ID Owner A Brown B Smith ID Quality A good B good Area of identity New node
Overlay • Vector topologic overlay: identity Output Build new topology A B C D ID Owner Quality A Brown good B Brown C Smith D Smith good Area of identity New node