Download
1 / 20
200 likes | 329 Vues
State Capacity, Demographic Change and Workforce Development. State Higher Education Executive Office Conference Summer 2007 Park Plaza Hotel Boston. Stephen P. Coelen University of Connecticut , Storrs CT WISER, Holyoke Community College, Holyoke MA

E N D
State Capacity, Demographic Change and Workforce Development State Higher Education Executive Office Conference Summer 2007 Park Plaza Hotel Boston Stephen P. Coelen University of Connecticut , Storrs CT WISER, Holyoke Community College, Holyoke MA University of Fort Hare, South Africa scoelen@wiser.hcc.mass.edu
2020 Vision of New England Demographic Change: The Perfect Demographic Storms I-III • This storm, like that of the recent movie, was caused by: • Younger minority population • Higher Hispanic fertility rate • Higher minority migration rates • Resulting in: • Higher natural increases in minority population • Higher migrations of minority persons If existing rates perpetuate themselves, we will obtain:
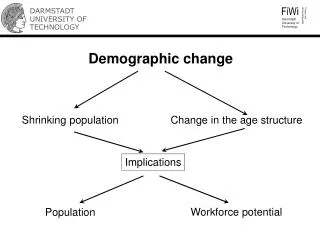
2020 Vision of New England Demographic Change: The Perfect Demographic Storm IV There will be a clear labor force problem in CT by 2020: • Adding to the first three forces, a fourth: • Historically lower minority educational attainment rates by race and ethnicity
15 % of Young Entrants with a Baccalaureate or more For all states but New Hampshire, the proportion of Baccalaureate holders will fall significantly without improvements in educational attainment
16 In Massachusetts, the decline in educational attainment of workers includes those with some college—Associate Degrees or incomplete work toward a baccalaureate For Massachusetts, while the the proportion of young with Baccalaureates will fall by 2.9%, the proportion with some college will fall by nearly 1.4% without educational improvements
17 In Connecticut, the decline in educational attainment of workers also includes all, from those with some college through those with completed baccalaureates and professional degrees 61.3% 57.0% Holders of associate degrees, certificates and partial work toward baccalaureate degrees 34.0% For Connecticut, while the the proportion of young with Baccalaureates will fall by 3.5%, the proportion with some college will fall by nearly 1% without educational improvements 30.5% Holders of baccalaureate, professional and advanced degrees
Integrated Education—Labor Policy to Create Crucial Workforce Development • Of Connecticut high school students going to college: • More than half go out-of-State to college, • All go to a panoply of colleges and • Few go to or graduate from CT private colleges • The public institutions seem to act as an integrated unit, • doing what most expect of the various levels, and • graduating reasonable proportions of their students • There is a significant brain drain from Connecticut because • There is too large a portion of the “bright kids” who don’t go on to any college after high school, and • For those who do, all too often, the brightest go out of State for college • Strategies would utilize the public system more
Connecticut high school students going to college: More than half go out-of-State for college 3.8% 6.6% 7.7% 51.1% ut 2.7% .5% 11.3% beyond Northeast
Percentage of Students • There is a significant Connecticut Brain-drain: • too large a portion of bright kids don’t go to any college after • high school, and • for those who go to College, all too often, the brightest go out- • of-State
Percent of Students Integrated activities of CT Public Higher Education: providing a diversity of access, opportunity, and competition across the various segments. The three public sectors do what is expected of them
Higher Education Strategies for Workforce Development Quality of Not Continuing to College and Those at CSU & CTC are equal
Higher Education Strategies for Workforce Development Quality of Those Leaving the State and Those at UConn are equal
Higher Education Strategies for Workforce Development in Connecticut At the University of Connecticut • Build capacity at UConn to attract those leaving the State • Strengthen the UConn Valedictorian/Salutatorian Scholarship Program At CSU and the Community Colleges • Establish Programs at CSU and the Community Colleges to attract those not currently continuing after high school And, everywhere: • Implement loan interest reduction programs for students depending on speed of completing their programs and eventual location for work • Involve students while still in college in more internship opportunities to develop student knowledge of Connecticut business • Consider entrepreneur opportunities for students who graduate from Connecticut colleges and who stay in State
Recommendations for Higher Education in Dealing with State Workforce Capacity • Never give up on youth as our future • Never use unidimensional testing measures when skills required for real-world success are multidimensional. • Pay less attention to passing every child on a test, and more on setting opportunities and access, real K-16 partnerships. • Open campuses and faculty to focus on the real world, • not squeezing more from faculty for more dollars • developing capacities for the business community, WISERTrade • Financing, depending on: • student speed • utilization of educational programs post-degree • creativity, developing from entrepreneurial collegiate programs • Pay attention to longer run: • Off shoring of jobs- some jobs will go, some will stay, be decisive and strategic about education’s role in this.
Thank you. Stephen P. Coelen scoelen@wiser.hcc.mass.edu
12 Educational Attainment by Race and Ethnicity Significant gaps in attainment among race/ethnic groups, however, occurred during the 1990’s Gains were greater for the white population than for other races and ethnicities
13 Changes in Attainment by Race and Ethnicity There was a small growth in numbers of white persons with completed baccalaureates in the 1990’s, but most gains came from improvements in attainment Much of the gain for minority populations came from increases in the population; much less came from improvements in attainment For the Hispanic population, there were decreases in participation rates in college and graduation rates from college
There are only two conclusionsConclusion #1: CAPT and SAT are quite different exams • Correlations between CAPT and SAT are quite small • There are huge overlaps in the distributions of the two exams, measured by • The Joint Distribution of the exam scores • The Distribution of SAT by CAPT score band • SAT and CAPT show different abilities to predict future success beyond high school, sometimes CAPT predicting better than SAT; sometimes SAT, better than CAPT; and sometimes they are independently useful in predicting specific outcomes • Therefore, it should not be a question of whether one exam should replace the other or vice versa. More information is better than less. CAPT and SAT provide independently useful information. More study should be given to which exam should be used for different purposes
2.Overlaps between CAPT and SAT b.i. Distribution of SAT by CAPT Math score band • A sizeable overlap in SAT by CAPT math score band
3. Differential Predictive Ability of CAPT and SAT e.ii. Passing More Credits by Semester vs. SAT Components Differences in accumulated credits over 8 semesters appear to be bigger for differences in Verbal than in Math SAT exams, but as will show on the next two slides, smaller than for comparable CAPT subject tests.