Download
1 / 32
400 likes | 907 Vues
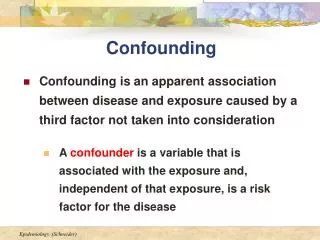
Confounding, Effect Modification and Odd-Ratio. ดร. อรพิน กฤษณเกรียงไกร คณะสาธารณสุขศาสตร์ มหาวิทยาลัยนเรศวร. Confounding bias. Criterion: A variable, C, is a confounder of a variable, X, if C is associated with X C is associated with the outcome variable, Y

E N D
Confounding, Effect Modification and Odd-Ratio ดร. อรพิน กฤษณเกรียงไกร คณะสาธารณสุขศาสตร์ มหาวิทยาลัยนเรศวร
Confounding bias Criterion: A variable, C, is a confounder of a variable, X, if • C is associated with X • C is associated with the outcome variable, Y • C is not a link in the causal chain between X and the outcome variable, Y Note: If Y is dichotomous (0/1) C must be associated with X separately for people with Y=0 and for people with Y = 1 Notation: X Y C
Confounding bias Example: Assume it is found that people who consume alcohol have a higher risk of developing oral cancer (OR >1). Alcohol use Oral cancer Smoking If the percentage of smokers is higher among people who drink alcohol then among people who don’t (among those with and those without oral cancer), part or all of apparent association between alcohol use and oral cancer is due to smoking. After adjusting for smoking the OR of alcohol consumption decreases and moves closer to 1.
Confounding bias Example: Assume it is found that being Mormon protects against oral cancer (OR >1). Being Mormon Oral cancer Smoking If the percentage of smokers is lower among Mormons than among other people (among those with and those without oral cancer), the apparent protective effect of being Mormon is due to the lower percentage of smokers among Mormons. After adjusting for smoking the OR of “being Mormon” increases and moves closer to 1.
Confounding bias Example: Assume it is found that people with high stress levels are at an only slightly greater risk of developing coronary heart disease (CHD) than people with low stress levels (OR >1). High stress level CHD Aspirin intake If the percentage of people who take Aspirin is higher among those with high stress level (among those with and among those without CHD), the association between high stress levels and CHD is underestimated. The underestimation is due to the higher percentage of people with high stress levels. After adjusting for Aspirin intake the OR of high stress level increases and moves further away from 1.
Confounding bias Example: In a study of the association between drinking water and oral cancer is “smoking” a confounder? It depends on whether the percentage of smokers varies among people with different drinking water supplies. Note: We can adjust for confounding (i.e. try to eliminate confounding) in the statistical analysis through. • Stratification of the effects of 2 factors are mixed. • Multivariate statistical modeling
Example of adjusting for confounding by stratification Crude 2x2 table Risk factor (RF), confounder (C), and disease (D) There is an association between risk factor (RF) and disease (D). Question: Is the OR distorted due to confounding? OR = 3.13
Crude 2x2 table 1. Determine, separately for D and D, whether the confounder (C) and the risk factor (RF) are associated. OR = 3.13 2x2 table of RF and C for people w/ the disease 2x2 table of RF and C for people w/o the disease OR = 81 (very strong association) OR = 81 (very strong association)
2. Determine, separately for RF and RF, whether the confounder (C) and the outcome (D) are associated. Crude 2x2 table OR = 3.13 2x2 table of C and D for people w/ the disease 2x2 table of C and D for people w/o the disease OR = 0.2 (strong association) OR = 0.2 (strong association)
Example of adjusting for confounding by stratification 1. Determine, separately for D and D, whether the confounder (C) and the risk factor (RF) are associated. The risk factor and the confounder are associated among those with and among those without the disease (OR is similar or the same for both stratum). Condition 1 is satisfied. 2. Determine, separately for RF and RF, whether the confounder (C) and the outcome (D) are associated. The confounder and the outcome are associated among those with and among those without the disease (OR is similar or the same for both stratum). Condition 2 is satisfied. 3.We must determine whether it is safe to assume C is not a link in the causal chain between RF and D. If this assumption can be made we can conclude that C is a confounder of D.
4. Determine the OR of the risk factor (RF) separately for C and C 2x2 table of C and D for people w/o the disease 2x2 table of C and D for people w/ the disease 2x2 table of RF and D for people w/ the disease 2x2 table of RF and D for people w/o the disease OR = 10 OR = 10
Example of adjusting for confounding by stratification • The crude OR of the RF (3.13) underestimates the true effect; the adjusted OR is much greater than the crude OR. • An example of this type of confounding is the high stress level/ aspirin/ coronary heart disease example above. Note: After stratification (i.e. after separation of the effects) we find that • The effect of the RF is not what we thought at first based on the crude OR • The effect of the RFis the same for those with and for those without the confounder.
Example of adjusting for confounding by stratification • Calculate the crude OR for the RF and the outcome. • Calculate the stratified OR’s for the RF and the outcome stratified by the levels of the confounder. If the crude OR and the stratified OR’s are very similar, no confounding is present. If the stratified OR’s are very similar but are different from the crude OR, confounding is present. If the stratified OR’s are different from each other and different from the crude OR, effect modification is present.
Effect Modification(Interaction) We encounter effect modification when the effect of one variable depends on another variable. Example: Assume a new treatment for a certain disease works very well for young people but not very well for old people. The effect of the treatment depends on age. We say that effect modification is present or that an interaction between treatment and exists.
Effect Modification (Interaction) Example: In a study of the association between a fatty diet and CHD is “high cholesterol level” a confounder? • High cholesterol is associated with a fatty diet (whether or not CHD is present). • High Cholesterol is associated with CHD. The first two requirements for a confounder are satisfied. • High cholesterol is a link in the causal chain between a fatty diet and CHD and can therefore not be a confounder. Fatty diet High cholesterol CHD
Effect Modification(Interaction) Note 1: Effect modification is not a bias but a description of the effect. Therefore, if effect modification is present our goal is to detect and to describe it. Recall: If confounding is present we try to eliminate it by stratification or multivariate statistical modeling. Note 2: Effect modification can be detected through • Stratification • Multivariate statistical modeling
Effect Modification (Interaction) What is the difference between confounding and effect modification? Recall: Smoking is a confounder of the association between alcohol consumption and oral cancer. Thus, the effect of alcohol consumption on oral cancer is mixed with the effect of smoking on oral cancer. To determine the true effect of alcohol consumption on oral cancer we must separate the two effects through stratification. Note: The effect of alcohol consumption on oral cancer is the same for smokers and non-smokers, i.e. it does not depend on a person’s smoking status.
Effect Modification (Interaction) Smoking is an effect modifier of the association between asbestos exposure and lung cancer. Thus, the effect of asbestos exposure on lung cancer depends on smoking status. The crude OR of asbestos exposure shows an average effect for smokers and non-smokers. This information is not very useful. However, if we stratify by smoking status and calculate the stratified OR’s of asbestos exposure, we get information about the effect of asbestos exposure on lung cancer separately for smokers and for non-smoker. The two stratified OR’s are different from each other and from the crude OR
Example of detecting effect modification by stratification Crude 2x2 table OR = 0.59 Oral contraceptive use seems to protect against Ovarian cancer. Risk factor (RF) is oral contraceptive use; Effect Modifier (EM) age; and disease (D) ovarian cancer Question: Since oral contraceptives have changed over the years, is the protective effect of oral contraceptives true for older and for younger women?
Crude 2x2 table We can answer this question if we stratify by age OR = 0.59 2x2 table of RF and D for old women 2x2 table of RF and D for young women OR = 0.13 (protective effect) OR = 1.7 (increase risk)
Effect Modification (Interaction) Note that the stratified odds ratios are different from each other and from the crude OR. This indicates that effect modification is present and that the crude OR is not a complete (or vary useful) description of the effect. The stratified analysis indicates that oral contraceptives only protect against ovarian cancer among older women, but slightly increase the risk of developing ovarian cancer among younger women. Note: Stratified OR’s can also be obtained from regression models. Statistical models are most useful when we are considering multiple risk factors, confounders, and effect modifiers, and when continuous variables are present.
Effect Modification (Interaction) Question: How do we know which variables to consider as potential confounders or effect modifiers? Answer: • Clinical Knowledge • Biological Knowledge • Common sense Note: It is impossible to think of every possible confounder or effect modifier. Therefore, we will practically never be able to determine the “true” OR.
Difference between effect modification and confounding Example of effect modification Assume we conducted a case-control study to explore the association between asbestos exposure and lung cancer. Further assume we got the following results: For the entire study population: OR asbestos, lung cancer = 25 Among smokers: OR asbestos, lung cancer = 35 Among non-smokers: OR asbestos, lung cancer = 15 The effect of asbestos exposure on lung cancer depends on whether or not the person smokes. It is much stronger for smokers than for non-smokers.
Difference between effect modification and confounding Example of effect modification Assume we conducted a case-control study to explore the association between playing card and lung cancer. Further assume we got the following results: For the entire study population: OR card, lung cancer = 3 Among old people: OR card, lung cancer = 1 Among non-smokers: OR card, lung cancer = 1 The effect of playing card on lung cancer does Not depend on age; it is the same for old and for young people. Playing card does not affect the risk of developing lung cancer differently in old and in young people.
Difference between effect modification and confounding Example of effect modification Comparing card players to persons who do not play card means comparing a group of mostly old persons to a group of many young persons. Thus, when only the crude effect is considered, we do not know whether the apparent association is due to playing card or due to age. By separating people into old and young persons, we can “untangle” the effects.
Summary Odds Ratios We are interested in the association between a risk factor (RF) and a disease (D). We stratify by smoking status to determine whether smoking is a confounder or an effect modifier. We find that the risk factor-disease OR’s in the two strata are almost identical (i.e. 2.0 and 2.1), but are different from the crude OR (i.e. 1.2). We conclude that smoking is a confounder. Which OR should we report as the OR for the risk factor-disease association? • Reporting the crude OR would mean reporting a biased result. • Reporting the two stratum specific OR’s would unnecessarily complicate the report.
Summary Odds Ratios Instead we calculate a summary odds ratio, i.e. a weighted average of the two stratum specific odds ratios. A commonly used summary odds ratio is the Mantel-Heanszel odds ratio. Let k be the stratum number, and K the total number of strata. Then OR MH = Σ (ak dk)/nk Σ (bk ck)/nk
Example The two stratum specific odds ratio are similar to each other and different from the crude odds ratio. Thus, we can calculate a summary odds ratio. Crude OR = 0.59 Stratum 1 Stratum 2 OR = 1.5 OR = 1.43
Summary Odds Ratios Then OR MH = Σ (ak dk)/nk = (a1d1)/n1 + (a2d2)/n2 Σ (bk ck)/nk (b1c1)/n1 + (b2c2)/n2 = (152x284)/796 + (280x720)/2040 = 1.45 (120x240)/796 + (880x160)/2040 Note: When the stratum specific ORs are different from each other we conclude that effect modification is present. In this case we Do Not calculate a summary OR, but report the two stratified ORs.
Summary Odds Ratios How do we determine whether stratum specific ORs are different? • We can use a significant test (i.e. the Breslow-Day test). • We can calculate the confidence intervals of the stratum specific OR’s and check whether CI1 includes OR2 and vice versa. 95% CI = exp (ln OR) + 1.96 √1/a + 1/b + 1/c + 1/d ) • We can use biological criteria to make the decision. Example 95% CI for the OR in stratum 1= exp (ln 1.5) +1.96 √1/152 + 1/120 + 1/240 + 1/284 ) = exp (0.41 + 0.29) or (1.13, 2.01); 95% CI includes 1.43 95% CI for the OR in stratum 2= exp (ln 1.43) +1.96 √1/280 + 1/880 + 1/160 + 1/720 ) = exp (0.36 + 0.22) or (1.15, 1.79); 95% CI includes 1.5
Summary Odds Ratios Thus, the stratum specific ORs not significantly different and a summary OR is appropriate. Note: Both stratum specific ORs are significantly different from the crude OR (1.08). If they were not and biological criteria did not dictate stratification, we could report the crude rather than the summary OR.
Reference • Annette Bachand, Introduction to Epidemiology: Colorado State University, Department of Environmental Health • Leslie Gross Portney and Mary P. Watkins (2000). Foundations of Clinical Research: Applications to Practice. Prentice-Hall, Inc. New Jersey, USA