Download
1 / 12
140 likes | 319 Vues
ANALYSIS OF LATHE VIBRATION INFLUENCE ON BLANK ROUGHNESS. TALLINN UNIVERSITY OF TECHNOLOGY. Ph.D Gennady Aryassov, M. Sc. Tauno Otto, M. Sc. Svetlana Gromova. AIM OF THE WORK.

E N D
ANALYSIS OF LATHE VIBRATION INFLUENCE ON BLANK ROUGHNESS TALLINN UNIVERSITY OF TECHNOLOGY Ph.D Gennady Aryassov, M. Sc. Tauno Otto, M. Sc. Svetlana Gromova
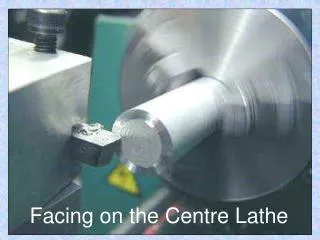
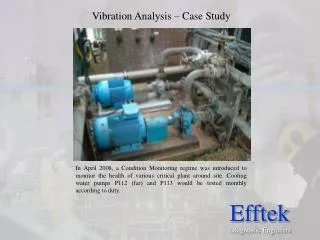
AIM OF THE WORK The effect of lathe vibrations to the roughness of machined surface was investigated on the base of the theoretical and experimental investigations. It gives the possibility to control and adjust the surface roughness of processing details. This knowledge gives the possibility to increase the accuracy of processing on different conditions of cutting.
a) with one degree of freedom y y=y0sinpt b) with two degress of freedom x z y y y x l z l THEORETICAL INVESTIGATION In the work the dynamic models with one and two degrees of freedom are accepted (Fig.1). Fig.1.Calculation dynamical models.
Calculation scheme with one degree of freedom (Fig.1a) The differential equation of forced vibrations induced by the foundation vibrations (1) у0is an amplitude of the foundation vibrations; JO is a moment of inertia of the blank; p=2f,f is the frequency of the foundation vibrations in Hz; kyis the spring constant of elastic support of the blank . From which a velocity of the forced vibrations induced by the foundation vibrations (2)
F y F l1 x y l (4) (5) The differential equations of forced vibrations in action of the cutting force F(Fig.2) Fig. 2. Calculation scheme in cutting. (3) where the cutting force F is reproduced as a sum of two items: the constant componentFr determined in practice by the simplified empirical formula and the variable component . The amplitude value of the variable component of the cutting force Fa is connected with the roughness value and changed in a rather wide range. whence the motion velocity with regard to initial conditions y0and v0
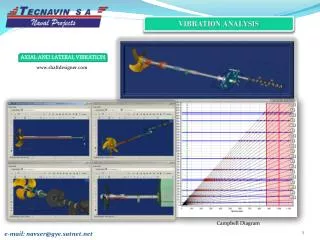
c z A y b a z C N zc y yc x 0 Calculation scheme with two degrees of freedom (Fig.1b and Fig.3) Fig.3. Gyroscope system with two degrees of freedom in cutting. (6) where is angular velocity of rotation of the blank, and are spring constants, A is moment of inertia of the blank with respect to axes of rotation. (7) where and are constants of integrations which are to be determined from the initial conditions; and are rations of the amplitudes for corresponding two principal modes of vibrations;p1and p2are natural frequencies of vibrations with gyroscopic forces (8) where
NATURAL FREQUENCIES FROM FREQUENCY ROTATION PRINCIPAL MODE OF VIBRATION second mode– reverse precision P1 – for direct precision P2 – for reverse precision first mode – direct precision Frequency rotation of the blank (rpm) The natural frequencies and principal modes of vibrations are given in the (Fig.4). The analysis shows when value of the is increased then difference between the lower frequency p1and higher frequency p2 is increased as well (Fig.4). Fig. 4. Principal modes of vibration corresponding to two different natural frequencies with gyroscope forces. Usually in studying of steady-state vibration drop the components determining free damping vibrations. However it is impossible to make in this instance, because operating conditions in the cutting due to roughness surface are changed.
indicators N2 N1 N3 320 630 F position I indicators N2 N1 N3 320 F 630 position II EXPERIMENTAL ANALYSIS One of characteristics is the spring constant of the lathe. The test was carried out in the case of two position of the load (Fig.5). Fig. 5. Scheme for measuring of the vertical and horizontal rigidity of the lathe. In the Fig.6 are given the results of mathematical statistical analysis the experiment data in the form of correlative straight lines, where coefficient of direct regression is the unknown rigidity. Fig. 6. Correlative function between the load and static displacement.
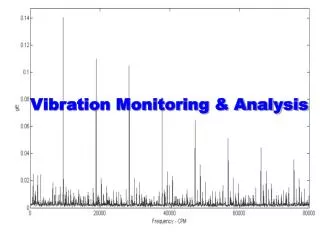
exsperiment theoretical Experimental analysis of vibration on idling of the lathe As the basic measurement equipment was used vibration analyzer SigLab 20.22A with programming supply in MATLAB, designed for multi-channel investigations of vibroacoustic signals in frequency band from 2 Hz to 50 kHz. As transducers piezoelectric accelerometers KISTLER 870B10 and KISTLER 8702B50 were used with sensitivity to 50 v/g. In additions the pocket sized vibrometer was used – collector data PICOLOG CMVL 10 of firm SKF for measuring in frequency band from 30 Hz to 10 kHz. The results of measuring of the vibration in horizontal plane are given in Fig.7, where reference theoretical results of vibration velocity according to Eq. (2) are given too. Fig.7. Experimental and theoretical results of the vibration in horizontal plane.
0,5 exsperiment 0,4 with giroscopic forces forces 0,3 theoretical Velocity, mm/s 0,2 0,1 0 0 100 200 300 400 500 Frequency, Hz Measuring of vibration in case of rotation of the blank Similar experiment was conducted in case of the rotating blank also. The test results in horizontal plane and corresponding theoretical results of vibration velocity are given in Fig.8. Fig.8. Experimental and theoretical results of vibration with gyroscopic forces.
0,7 theoretical with giroskopic forces experiment 0,6 0,5 Velocity, mm/s 0,4 0,3 0,2 0,1 0 0 test 1 test 2 test 3 test 4 test 5 test 6 Measuring of vibration in cutting Experimental measuring was performed with different cutting speeds, feeds and depths of cut. Test results and results of the calculation are given in Fig.9. Fig.9 Comparative analysis of experimental and theoretical results. After every cutting the surface roughness was measured by profilograph ‘Surftronic 3+’. The amplitude value of the variable component of the cutting force in Eq. (4) was taken according to the experimental value of the roughness.
CONCLUSION • The processing of the roughness measurements data confirmed precision of the calculation model. • Surface roughness parameters of the blank quite satisfactory agreed with the corresponding data of the theoretical investigation. • The results of experimental and theoretical investigations confirmed the theoretical hypothesis especially when calculation model with two degrees of freedom was used. • This knowledgegives the possibility to increase the accuracy of processing on different conditions of cutting. • It was remained without investigation an important question of stability of the blank in the action of the moving cutting force. • In future calculation models with four degrees of freedom are supposed to use. And finally it is necessary to derivative theoretical expressions with help of which we can exactly determine the roughness. • The last gives the possibility to control and adjust the surface roughness of processing details. But for it is demanded to conduct the large number of experiments with good equipment.