Download
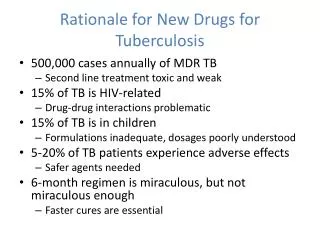
1 / 23
230 likes | 262 Vues
Tuberculosis Drugs. Spreadsheet Documentation. General Information. Link to spreadsheet : https://docs.google.com/a/binghamton.edu/spreadsheet/ccc?key=0AuIkrFbUTuZldHJPZGtUNV9CSVFraEQ0TWZ2MkNrOVE&usp=drive_web#gid= 1 Spreadsheet contains data regarding Summary of company rankings

E N D
Tuberculosis Drugs Spreadsheet Documentation
General Information • Link to spreadsheet:https://docs.google.com/a/binghamton.edu/spreadsheet/ccc?key=0AuIkrFbUTuZldHJPZGtUNV9CSVFraEQ0TWZ2MkNrOVE&usp=drive_web#gid=1 • Spreadsheet contains data regarding • Summary of company rankings • WHO groupings and country categorizations • The burden of Malaria and the data of its drugs by countries • The burden of TB and the data of its drugs by countries • The burden of HIV and the data of its drugs by countries
Tab (1)Summary of Company Rankings • List of pharmaceutical companies, their drugs and target diseases • Ranking of the companies’ total impact scores: • Total impact scores = Need (DALYs lost) * Access (Treatment coverage) * Efficacy • Ranking of the companies break down by diseases • Total DALYs alleviated in different diseases break down by WHO regions
Tab (4)Tuberculosis by Countries • General information • Column A: List countries • Column B: Countries sorted by WHO regions • Column C: population • Column D: DALYs lost to TB break down by countries (2010 data)
All TB Incident Cases Drug-Susceptible ("Normal") active TB HIV+ HIV- XDR-TB MDR-TB Tab (4)Tuberculosis by Countries • Different kinds of TB • Drug-susceptible (Normal) TB • Multiple drug resistant (MDR) TB • Extreme drug resistant (XDR) TB • TB and HIV
Tab (4)TB regimens and treatment protocols • Column G & H and Row 41-90: Standard treatment protocols • G129 to I134: Drug-resistant treatment protocols
Tab (4)List of Anti-TB drugs • G142 to I171: List of Anti-TB drugs
Tab (4)Tuberculosis Assumptions • Column J & K / Row 22-45: Assumptions
Tab (4)Prevalent and incidence cases • Column J and K:TB prevalence and incidence by countries • Prevalence: The total number of cases of disease existing in a population • Incidence: The total number of newly diagnosed cases of a disease
Tab (4)HIV Status • Column L: The percent of TB cases with a known HIV status, according to the WHO • Column M: The number of TB cases with known HIV status (WHO) • Column N: Number of cases that are TB/HIV+
Tab (4)Prevalent and incidence cases • Column O-R: • Incident cases of active TB with HIV+/HIV- • % of active TB with HIV+/HIV- = The number of active TB with HIV+ or HIV- / The number of TB incidence with known HIV status.
Calculating Impact Score: MDR-TB • DALYs lost to MDR-TB by country • Column AB-AH: Calculating proportion of cases that have MDR-TB (column AH) AD/AE= AG AB/AC = AF (AB+AD) / (AF+AG) = AH
Calculating Impact Score: MDR-TB • #MDR-TB needing treatment (AI) = TB prevalence (J) * proportion of new and retreatment cases that have MDR-TB (AH) • DALYs lost to MDR-TB (AL) = Total DALYs lost to TB (D) * MDT-TB proportion (AH) – DALYs lost to XDR-TB (AQ) • Treatment Coverage of MDR-TB by country (AK) = # MDR-TB receiving treatment (AJ) / # MDR-TB needing treatment (AI) • Treatment Efficacy of MDR-TB (I25): Assumption • AM: Impact of MDR-TB treatment regimen = Need (DALYs lost to MDR-TB (AL)) * MDR-TB treatment coverage (AK) * MDR-TB treatment efficacy (I25)
Calculating Impact Score: MDR-TB • The proportion of the impact each regimen in the MDR-TB treatment protocols is inversely proportional to resistance rates (G173-H178)
Calculating Impact Score: MDR-TB • Each drug within each regimen receives an equal proportion of that regimen’s impact (G47-I66) • A company’s total impact of MDR-TB regimen =
Calculating Impact Score: MDR-TB • A company’s total impact of XDR-TB regimen = The company’s proportion of credit for MDR-TB treatment (based on the sum of the anti-MDR-TB drugs it produces) multiplied by the sum of impact of MDR-TB treatment regimen in each country.
Calculating Impact Score: XDR-TB • DALYs lost to XDR-TB by country • Assumption I31: 9% of all MDR-TB cases are XDR-TB (WHO 2013) • DALYs lost to XDR-TB (AQ) = Total DALYs lost to MDR-TB (D) * MDR-TB proportion (AH) * 9% • XDR-TB Treatment Coverage (AP) = 43% (assumption I38) • XDR-TB treatment Efficacy (I26) = 20% (assumption I26) • Impact of XDR-TB treatment regimen (AR) = Need (DALYs lost to XDR-TB (AQ)) * XDR-TB treatment coverage (AP) * XDR-TB treatment efficacy (I26)
Calculating Impact Score: XDR-TB • The total impact of XDR-TB treatment is divided according to XDR-TB treatment protocols (G86-I91) • A company’s total impact of XDR-TB regimen = The company’s proportion of credit for XDR-TB treatment (based on the sum of the anti-XDR-TB drugs it produces) multiplied by the sum of impact of XDR-TB treatment regimen in each country.
Calculating Impact Score: Normal TB – Needs • Total DALYs lost to normal TB (U) = Total DALYs lost to TB (D) – the DALYs lost to MDR-TB (AL) – the DALYs lost to XDR-TB (AQ)
Calculating Impact Score: Normal TB – Access and Efficacy • Treatment coverage for TB/HIV+ (X) = 65.9% (Assumption about drug-susceptible TB treatment coverage (I39)) • Treatment coverage for TB/HIV- (Y) = 65.9% (Assumption about drug-susceptible TB treatment coverage (I39)) • Treatment Efficacy of TB/HIV+ (I23): 73% (assumption I23) • Treatment Efficacy of TB/HIV- (I24): 87% (assumption I24)
Calculating Impact Score: Normal TB • A company’s total impact of normal TB regimen = The company’s proportion of credit for standard treatment multiplied by the sum of the impacts of the normal TB treatment regimen in each country.
Calculating Impact Score by Companies • G5 to H13: Companies and their drugs • A company’s total impact score in TB = The sum of total impact score in treating normal TB, MDR-TB and XDR-TB