Download
1 / 93
950 likes | 1.14k Vues
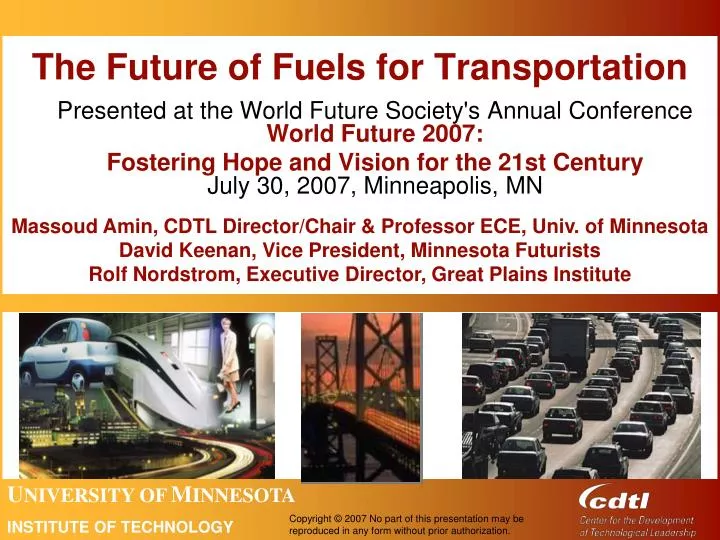
The Future of Fuels for Transportation. Presented at the World Future Society's Annual Conference World Future 2007: Fostering Hope and Vision for the 21st Century July 30, 2007, Minneapolis, MN . Massoud Amin, CDTL Director/Chair & Professor ECE, Univ. of Minnesota

E N D
The Future of Fuels for Transportation Presented at the World Future Society's Annual ConferenceWorld Future 2007: Fostering Hope and Vision for the 21st CenturyJuly 30, 2007, Minneapolis, MN Massoud Amin, CDTL Director/Chair & Professor ECE, Univ. of Minnesota David Keenan, Vice President, Minnesota Futurists Rolf Nordstrom, Executive Director, Great Plains Institute
Background • Price of fuel for cars and light trucks is increasing • Increasing demand from developing populations • Declining discoveries of crude oil • Conflicts in oil producing regions • US consumer demand exceeds US supply • Reliance on exports • Energy security concern • Burning gasoline for transportation creates environmental problems, smog, CO2, etc.
Background • Global light vehicle ( cars and light trucks) production - 55 to 60 million/yr • Estimated 500 million light vehicles in use • 78% gasoline • 22% diesel • Growth of Ownership
Context: • In the U.S., we have: • - 2% of the World’s oil reserve; • - 8% of World oil production; • - 5% of the World population; • - we consume 25% of World’s production, and • - more than 2/3 of our consumption is imported. • Emerging economies increased demand are changing the “balance,” e.g. China, • - China has bought excess capacity of Canada, • - Almost bought Unocal; major commitments from Mideast. • In 2005 we launched one new submarine, • China launched 14 (albeit lower quality)…
Context: Cities with 10 million people • By 2020, more than 30 mega-cities in the now less-developed world. By 2050, nearly 60 such cities. • Increased population creates need for more resources. World's electricity supply will need to triple by 2050 to keep up with demand, necessitating nearly 10,000 GW of new generating capacity.
Highway Carbon Emissions 14 (million metric tons) Domestic Oil Production 1990 2000 2010 2020 12 Commercial Vehicles 325 386 474 541 10 Heavy Trucks 8 Million Barrels per Day 6 Light Trucks Passenger Vehicles 4 2 Automobiles 0 1970 1980 1990 2000 2010 2020 U.S. Transportation Demands More Oil Actual Projected Source: Transportation Energy Data Book Edition 20, DOE/ORNL-6959, October 2000, and EIA Annual Energy Outlook 2001, DOE/EIA-0383(2001), December 2000.
Supply Considerations Estimates of World Conventional Oil Production & U.S. Natural Gas Production Source: Department of Energy
Issues facing US consumers • What fuel price would influence you to choose a new vehicle type? • Europe currently pays about $6/gal due to taxes • US is considering increasing gas tax • What vehicles will be available? • What fueling station infrastructure will be convenient?
Answering Consumer ChallengesAn Example: Galvin Electricity Initiative • Each day, roughly 500,000 Americans spend at least two hours without electricity (cost to our economy $150B/year). • The future looks even worse. Without substantial innovation and investment, rolling blackouts and soaring power bills will become a persistent fact of life in this country. • Mission: The Galvin Electricity Initiative is leading a campaign to create a perfect power system. A perfect power system cannot fail the consumer. It is environmentally sound and fuel-efficient. It is robust and resilient; able to withstand natural and weather-related disasters and mitigate the potential damage caused by terrorist attack. The perfect power system provides affordable electricity to all consumers and allows consumers to control their own energy use to the extent they choose. • History: The Galvin Electricity Initiative was officially launched in 2005, but its genesis dates back to the massive East Coast blackout of August 2003, which left nearly 50 million people without power and inspired former Motorola chief to take action. Source: http://www.galvinpower.org/
S&T Assessment, Scan and Map(April 2005-Feb 2006; Galvin Electricity Initiative, Task 3, Phase 1) Objectives: • Identify the most significant Science & Technology innovations which would meet energy service needs over the next 10 or 20 years. • Determine Science & Technologies areas and concepts which address customer aspirations and hopes: • Technologies that encourage job creation and address the needs of the society; • An energy system so robust and resilient that it will not fail; • A totally reliable, secure communication system that will not fail. Source: Galvin Electricity Initiative http://www.galvinpower.org/
Societal/Human Needs→ Technology → System What will be its needs for systems consuming energy (functionally)? What existing and emerging technologies can meet those needs? What power system implications do those solutions imply? How will society evolve? Are there entirely new pivotal technologies which could be potentially available? Killer Ap? Will those influence society? Are there applications of pivotal science and technology outside energy that may apply?
How do we figure out what may work? Consumer Needs Technology Potential Technology Scan • Identify societal attributes • How may society’s technology needs evolve (scenario)? • What will be the technology needs of those societies? • Identify dominant needs • Determine the potential of known (existing and emerging) technologies • Determine where clustersof applications exist • Scan the technology horizon broadly for innovation possibilities Nodes of Opportunity
Examples of Technology strengths of the industry today • Examples of Technology strengths of the industry today include: • Power Electronics • Adv. Electric motors • Wind generation • Nuclear Power • Solar power • Systems integration • Real-time systems control • Personal storage devices • Power conditioning • Efficient illumination • Emission control • Turbine generation • Adv. Materials technology • Security technology Information Science leading Industry Application Status strong capable 7 Industry’s Technology PowerZone™ 6 11 14 2 13 9 3 10 4 1 5 8 12 Physical Science Bio- and Life Sciences
Expanding the Power Zone Info • A. Distributed control • B. Electronic power commerce • C. Distributed generation/storage • D. Integrated common infrastructure • E. Integrated/Embedded PV • Wireless backup • Granular Semi-autonomous Architecture • Fractal Grid Lego Model • Lego Model • Plug and play appliances A B H F I G C J E D Biological Physical Technology Map for the Granular Semi-Autonomous Architecture
Expanding and Transforming the Power Zone Technology Map for Bio-fuel Systems, Distributed Gen and Storage systems integrated with Advanced Information Systems for Network Management Information Science 4 Extended Power Zone 8 3 6 Existing Power Zone 5 Bench-marking 2 7 1 Physical Science Bio./Life Science
R& D Strategies and Examples of Technology areas Identify Real Applications to Pull Technology Develop into Products High Potential -- Elaborate, Expand, Drive Investment Not strategic - evaluate as separate opportunity Sustain and Grow- Industry and other resources Alliances, Government, University
Future Consumer Needs Relieve Congestion Reduce Energy Use Revitalize Cities Transportation Serve Diverse Communities Source: Galvin Electricity Initiative
Big 4 issues automakers face in meeting those needs • Energy diversity • Climate change • Population and Congestion • Air quality
Transportation Fuel Options that Meet These Challenges are Limited • Electricity (plugging into the grid): Requires “greening the grid” and solving storage/battery issues • Liquids from coal: Without CCS*, this would be worse than gasoline from a climate standpoint • Biofuels: UCS study on biofuels suggested that they could perhaps meet 30 to 50% of U.S. transportation fuel needs. We’ll still need that other 50%! • Hydrogen: Made from renewable and low-carbon sources * CCS: Carbon Capture and Sequestration
Co-Evolution of Vehicles & Fuels Low- no-CO2 Hydrogen Low- no-CO2 Grid Electricity Biofuels from cellulose & other renewable sources Fuels from coal w/CO2 capture & sequestration FUELS evolving toward domestic, low- no-CO2 options Gasoline & Diesel Hydrogen Grid Electricity Biofuels from cellulose & other renewable sources Fuels from coal w/CO2 capture & sequestration 1) Few alternatives to gasoline 2) Must move along evolutionary path ASAP Gasoline & Diesel (176,000 gas stations) Corn Ethanol (E85) (100s of U.S. stations) Soy Biodiesel (100s of U.S. stations) Natural Gas (1,600 stations in U.S.) Hydrogen (~ 100 stations worldwide) We are here. (97% reliant on OIL) Hybrid ICE & Fuel Cell Vehicles AND/OR Plug-in Hybrid ICE & Fuel Cell vehicles Plug-in hybrid ICE flex-fuel vehicles Battery can be recharged by the electric grid, extending the vehicle’s electric-only range. Hybrid Fuel Cell vehicles Gasoline Diesel Flex-fuel ICE vehicles (E-85 & gasoline) Hybrid-ICE vehicles Cleaner diesel ICE vehicles Conventional ICE vehicles “ICE” = Internal Combustion Engine 2020 & beyond 2010 Little/no OIL in transportation by 2050 1993-1997-2009 VEHICLES evolving toward hybrids = less oil, air pollution and greenhouse gases 1901 www.gpisd.net Date of 1st mass vehicle introduction
One Transition Strategy: GEM Flexibly Fuel Vehicles (FFV) One Tank To Hold Them All G: Gasoline E: Ethanol M: Methanol With an FFV, you choose each day which to buy At $100-200/car, a more open competition, level playing field, better unleash the power of the free market 40% of new cars in Brazil GE flexible already
Vehicle & Fuel Evolution Already Underway Both GM and Toyota pursuing: • Hybrid ICEs • Plug-in ICEs • Plug-in hydrogen fuel cell electrics. Chevy Volt Ford Edge Honda FCX
Chevy Volt as example of vehicle trends • Fuel cell is simply used as a range-extender (not as a replacement for the ICE). • The fuel cell simply keeps the battery charged • Easier to put electric infrastructure in place than H2 infrastructure.
Do any hydrogen vehicles exist today? • Every major automaker has prototypes • 400-500 vehicles on the road • 38 Hybrid Priuses have been converted to run on hydrogen, most operating in 5 cities in LA basin • At least 10 types of H2 ICE vehicles deployed or being developed
When might you buy a fuel cell vehicle? • Automakers racing to be first; GM says by 2011 • Both Honda and BMW have announced plans to go to production BEFORE 2010 • Others think longer or never • First vehicles are fleets GM’s Sequel, 300 mile range GM putting 100 of these on the road in 2007
GM Targets for Deployment 2007 to 2010: 100 vehicles (10 stations) 2011 to 2013: 1000 vehicles (100 stations) 2014 to 2016: 10,000 vehicles (250 stations) Commercial deployment in mass market Chevy “Volt” plug-in hybrid
1st fuel cell family has completed first year Honda FCX4 Jon and Sandy Spallino and daughters, Redondo Beach, California
Are there any hydrogen stations today? • >100 stations worldwide • California has 23 stations; 15 more underway; 100 planned by 2010 • 1st public station in Washington DC • 170 new stations planned (VT, OH, CA, DC, FL, NV, NY, etc.) • CA, FL, NY, Canada, Japan and Norway have “H2 highway” projects H2 Highway in BC
How Soon? U.S. Goal: Fuel cell vehicles in the showroom and hydrogen at filling stations by 2020
Market Transformation of Electric Drive Vehicles Source: EPRI
Tomorrow’s Grid • Smart • with sensors • Flexible and Resilient • an intelligent network with real-time monitoring and control • Self Healing • capable of predicting or immediately containing outages with adaptive islanding and fast isolation or sectionalizing • Established Standards • enabling “plug and play” distributed resources and digital appliances and devices
Role of Vehicles and Fuel Cells in the ‘Smart Grid’ • Distributed Energy Resources (DER) • Power quality and reliability • Backup • Load leveling – when loads and prices are high • DER potentially 25% U.S. electricity in 2020 • ‘Plug and Play’ capability • Grid design for multiple power flows • Standards • Equipment ‘signatures’ and requirements • ‘Smart Vehicles’ from interconnected power systems and communications
Value Proposition • Energy security as electricity provides fuel substitute for petroleum • Efficiency improvements result in significant fuel mileage increases and emissions reduction • Faster fuel cell market penetration due to lower cost of fuel cell when linked to an energy storage system • Electric drive systems in the full range of auto, truck, and non-road product offerings • A potential future as mobile distributed resources link to electricity grid • A cleaner environment as Electric Drive market share grows • Load leveling Source: EPRI
Full Fuel Cycle Efficiency Comparison Plug-in Hybrid 1631 – 2185 miles Per Barrel 0.31–0.50 2116 Btu/mile 0.29–0.47 1.0 Conventional 1231 miles Per Barrel 0.84 4115 Btu/mile
Hybrid Vehicle Efficiency Engine Gas tank Transmission Driveline 15-20% 90-95% 95% Motor Battery Gasoline: 13-18% Efficient Electric: 62-77% Efficient 85-90% 85-95%
Petroleum Reduction Up to 85% reduction in gasoline use and trips to gas station (HEV60).
“Electrifying America’s Transportation:A Value Proposition for Electric Drive Vehicles” A study by Professor James A. Weinbrake, James Madison University, 2002 Sponsored by EPRI’s Technology Roadmap Project • Assumes by 2025 • Half of all cars are Hybrids • Half of those are plug-in Hybrids • Based on DOE – EIA projections for energy use
Hybrid Electric Vehicle (HEV) Comparison Plug-in HEVs: • reduce emissions, energy use, CO2, and petroleum consumption more than power assist HEVs • yield greater benefits as range increases • All HEVs can be expected to cost more than CVs • Even at significantly higher capital costs, plug-in HEVs can succeed in the market
2) Bioenergy Biomass as transport fuel and/or grid power
Biorefinery: Feedstock to any Product USES Fuels: Ethanol Renewable Diesel Hydrogen Power: Electricity Heat Chemicals Plastics Solvents Chemical Intermediates Phenolics Adhesives Furfural Fatty acids Acetic Acid Carbon black Paints Dyes, Pigments, and Inks Detergents Etc. Food and Feed Hydrolysis Sugars and Lignin Acids, enzymes Gasification Synthesis Gas Feedstock production,collection, handling & preparation High heat, low oxygen Digestion Bio-gas Bacteria Pyrolysis Bio-Oil Catalysis, heat, pressure Extraction Carbon-Rich Chains Mechanical, chemical Separation Plant Products Mechanical, chemical
Biomass Resources: Many regional options • Evolution from: • Corn ethanol • Biodiesel • Toward: • Cellulosic ethanol: • - Ag. residues, wood waste, native grass.
Ethanol and E85 • Ethanol is a biofuel alternative to gasoline • Contains 35% oxygen, burns cleaner than gasoline • Highly biodegradable, less problems from leaks • E10 is 10% ethanol and 90% unleaded gasoline • Used in 46% of US, especially in winter to cut smog • Used to replace MTBE as octane booster • E85 is 85% ethanol and 15% unleaded gasoline • Pricing attractive vs. unleaded gas • Land and energy requirements limit corn ethanol to a transition fuel
Other Options for Ethanol Production • 2004 global production 10 billion gallons • 38% produced in Brazil using 4.5% of crop land • Mass produced by fermentation of starch or sugar • Crop yields gallons/acre • Corn 370 • Sugar Cane 662 • Sugar Beet 714 • Poplar hybrid 1000 (UM Duluth) • Switchgrass 1150 • Miscanthus 1500 • Can be produced from algae – (UM Twin Cities)