Download

1 / 24
240 likes | 526 Vues
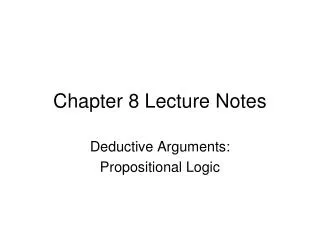
Chapter 8 notes. Supply. Price buyers. Size of tax. pay. Price. without tax. Price sellers. receive. Demand. Quantity. Quantity. with tax. without tax. Figure 1 The Effects of a Tax. Price. The price paid by consumers is higher. The price received by firms is lower. Who benefits?.

E N D
Supply Price buyers Size of tax pay Price without tax Price sellers receive Demand Quantity Quantity with tax without tax Figure 1 The Effects of a Tax Price The price paid by consumers is higher The price received by firms is lower. Who benefits? And the quantity declines. Quantity 0
Tax Revenue T = the size of the tax Q = the quantity of the good sold T Q = the government’s tax revenue
Supply Price buyers Size of tax (T) pay Tax revenue (T × Q) Price sellers receive Demand Quantity sold (Q) Quantity Quantity with tax without tax Figure 2 Tax Revenue Price Quantity 0
Welfare, Taxes and Total Surplus • Without tax – market is at equilibrium; total surplus is area between the S and D curves up to EQ • With tax – total surplus = new consumer surplus + tax revenue + new producer surplus
Deadweight Loss • When taxes are enacted, buyers and sellers are worse off and gov’t is better off • Total surplus falls • Deadweight Loss = the fall in total surplus b/c of a distortion such as a tax • Taxes cause deadweight losses because they prevent buyers and sellers from realizing some of the gains from trade
Supply A Price buyers PB = pay B C Price P1 = without tax E D Price sellers PS = receive F Demand Q2 Q1 Figure 3 How a Tax Effects Welfare Price Quantity 0
Change in total welfare • The change in total welfare includes: • The change in consumer surplus, • The change in producer surplus, and • The change in tax revenue. • The losses to buyers and sellers exceed the revenue raised by the government. • This fall in total surplus is called the deadweight loss.
Lost gains Supply from trade PB Size of tax Price without tax PS Cost to Demand sellers Value to buyers Q2 Q1 Reduction in quantity due to the tax Figure 4 The Deadweight Loss Price Quantity 0
Determinants of Deadweight Loss • What determines whether the deadweight loss from a tax is large or small? • The magnitude of the deadweight loss depends on how much the quantity supplied and quantity demanded respond to changes in the price. • That, in turn, depends on the price elasticities of supply and demand.
Supply When supply is relatively inelastic, the deadweight loss of a tax is small. Size of tax Demand Figure 5 Tax Distortions and Elasticities (a) Inelastic Supply Price 0 Quantity
When supply is relatively elastic, the deadweight loss of a tax is large. Supply Size of tax Demand Figure 5 Tax Distortions and Elasticities (b) Elastic Supply Price Quantity 0
Supply Size of tax When demand is relatively inelastic, the deadweight loss of a tax is small. Demand Figure 5 Tax Distortions and Elasticities (c) Inelastic Demand Price Quantity 0
Supply Size of tax Demand When demand is relatively elastic, the deadweight loss of a tax is large. Figure 5 Tax Distortions and Elasticities (d) Elastic Demand Price Quantity 0
Size of DWL • The greater the elasticities of demand and supply: • the larger will be the decline in equilibrium quantity and, • the greater the deadweight loss of a tax.
The Deadweight Loss Debate • Some economists argue that labor taxes are highly distorting and believe that labor supply is more elastic. • Some examples of workers who may respond more to incentives: • Workers who can adjust the number of hours they work • Families with second earners • Elderly who can choose when to retire • Workers in the underground economy (i.e., those engaging in illegal activity)
DWL and Tax Revenue • With each increase in the tax rate, the deadweight loss of the tax rises even more rapidly than the size of the tax. • For the small tax, tax revenue is small. • As the size of the tax rises, tax revenue grows. • But as the size of the tax continues to rise, tax revenue falls because the higher tax reduces the size of the market.
Deadweight loss Supply PB Tax revenue PS Demand Q2 Q1 Figure 6 How Deadweight Loss and Tax Revenue Vary with the Size of the Tax (a) Small Tax Price Quantity 0
Deadweight loss PB Supply Tax revenue PS Demand Q2 Q1 Figure 6 How Deadweight Loss and Tax Revenue Vary with the Size of the Tax (b) Medium Tax Price Quantity 0
PB Deadweight loss Supply Tax revenue Demand PS Q2 Q1 Figure 6 How Deadweight Loss and Tax Revenue Vary with the Size of the Tax (c) Large Tax Price Quantity 0
As the size of a tax increases, its deadweight loss quickly gets larger. • By contrast, tax revenue first rises with the size of a tax, but then, as the tax gets larger, the market shrinks so much that tax revenue starts to fall.
Figure 6 How Deadweight Loss and Tax Revenue Vary with the Size of a Tax (a) Deadweight Loss Deadweight Loss Tax Size 0
CASE STUDY: The Laffer Curve and Supply-side Economics • The Laffer curve depicts the relationship between tax rates and tax revenue. • Supply-side economics refers to the views of Reagan and Laffer who proposed that a tax cut would induce more people to work and thereby have the potential to increase tax revenues.
Figure 6 How Deadweight Loss and Tax Revenue Vary with the Size of a Tax (b) Revenue (the Laffer curve) Tax Revenue Tax Size 0