Download

1 / 41
640 likes | 1.51k Vues
Introduction to MALDI-TOF. Jennifer Krone Ph.D. Senior Field Application Specialist. Basic Components of a Mass Spectrometer. Vacuum Envelope. Ionization. Mass Sorting (filtering). Detection. Ion Source. Ion Detector. Mass Analyzer. Forms ions (charged molecules).

E N D
Introduction to MALDI-TOF Jennifer Krone Ph.D. Senior Field Application Specialist
Basic Components of a Mass Spectrometer Vacuum Envelope Ionization Mass Sorting (filtering) Detection Ion Source Ion Detector Mass Analyzer • Forms ions • (charged molecules) Sort Ions by Mass (m/z) • Detect ions Data System Mass Spectrum Relative Abundance Sample Inlet Sample/Matrix dried on MALDI Plate 2000 1000 m/z
Mass Spectrometer Schematic Vacuum envelope Sample Inlet Ion Mass Detector in System Source Analyzer Data Inlet systems: Simple vacuum lock • System HPLC • GC • Ion sources: Electrospray (ESI) • Mass MALDI • spectrum FAB/LSIMS • out Electron ionization (EI) • Mass analyzers: Quadrupole • Time - of - flight • Ion trap • Magnetic sector • FTMS •
Ion Sources make ions from sample molecules • For biological applications, ion sources convert neutral molecules to ions by adding (taking away) one or more protons. • Ions may be singly or multiply charged. • Ions are easier to control in the mass spectrometer than neutral molecules. • Ions are easier to detect than neutral molecules. • In Voyager MALDI-TOF MS ions are formed in pulses at 3 – 20 cycles per second.
Ion Sources Make IonsFrom Sample Molecules • For biological applications, ion sources convert neutral molecules to ions by adding or taking away one or more protons. • Ions may be singly or multiply charged. • Ions are easier to control in the mass spectrometer than neutral molecules. • Ions are easier to detect than neutral molecules. M + H+ + energy =MH+ [M+2H]2+ + + + +
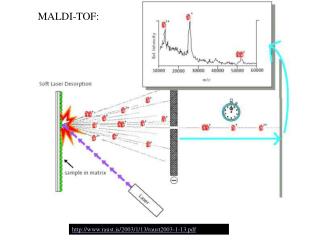
Primary Ionization Techniques for Biological Molecules • Electrospray Ionization (ESI) • Includes high (ml) and low (nl) flow rate liquid transfer • NanosprayTM Ion Source • ElectrosprayTM Source • Micro Ion SprayTM Source • Turbo Ion Spray TM Source • Matrix Assisted Laser Desorption Ionization (MALDI) • Sample is dissolved with an energy transferring compound or “matrix” • This is spotted on to a metal plate and allowed to crystallize • When a laser is applied matrix crystals transfer energy facilitating ionization
+ + + + + + + + To MS + – + + + + + + – + + + Electrospray Ionization (ESI)* Vacuum Interface charged droplets form High Voltage – + + Sample Flow + + Nebulizer Gas Ions released Spray * Broad range of implementations based on flow rate and polarity of compound class
ESI Spectrum of Trypsinogen (MW 23983) M + 15 H+ 1599.8 M + 16 H+ M + 14 H+ 1499.9 1714.1 Relative Abundance M + 13 H+ 1845.9 1411.9 1999.6 2181.6 m/z Mass-to-charge ratio
AH+ Matrix Assisted Laser Desorption Ionization (MALDI) Laser Sample plate hn • 1. Sample (A) is mixed with excess matrix (M) and dried • on a MALDI plate. • 2. Laser flash ionizes matrix molecules. • 3. Sample molecules are ionized by proton transfer from matrix: • MH+ + A M + AH+. Variable Ground Grid Grid +20 kV
40000 30000 20000 10000 0 MALDI/TOF Mass Spectrum of IgG MH+ Relative Abundance (M+2H)2+ (M+3H)3+ 50000 100000 150000 200000 m/z
Mass Analyzers Measure The Mass of Ions • Operate under high vacuum (keeps ions from bumping into gas molecules) • Actually measure mass-to-charge ratio of ions (m/z) • Key specifications are resolution, mass accuracy, sensitivity and mass range.
Another parameter to remember:Isotopes 1981.84 1982.84 1983.84 Most elements have more than one stable isotope. For example, most carbon atoms have a mass of 12 Da, but in nature, 1.1% of C atoms have an extra neutron, making their mass 13 Da. Mass spectrum of peptide with 94 C-atoms (19 amino acid residues) “Monoisotopic mass” No 13C atoms (all 12C) One 13C atom Two 13C atoms
Mass Analyzers Employed in Modern Proteomics • Quadrupole (including multiple Quadrupoles): • Unit resolution capabilities using frequencies to separate ions. Low mass accuracy and resolution. Limited mass range. • Time of Flight (including multiple TOF): • High resolution and accurate mass capabilities using time and distance to separate ions. Unlimited mass range. • Ion Trap: • Unit and higher resolution capabilities using frequency to separate ions. Moderate mass accuracy, limited mass range. • Fourier Transform (FT): • High resolution and mass accuracy using frequency to separate ions. • Hybrid: • Combination of different types of analyzers to achieve specific application requirements.
Quadrupole Mass Analyzer Uses a combination of Radio Frequency(RF) and Direct Current(DC) voltages to operate as a mass filter. • Has four parallel metal rods. • Lets one mass pass through at a time. • Can scan through all masses or sit at one fixed mass.
QTRAP Hybrid Mass Spectrometer 3D Trap Full Scan Sensitivity MS3 (or greater) Q Trap Tandem in SPACE & TIME Tandem in TIME Full Scan Sensitivity MS3 MRM Sensitivity Neutral Loss Precursor Scan + Novel Scan Types QqQ MRM Sensitivity Neutral Loss Precursor Scan Tandem in SPACE
Mass Spectrometers used in proteome research Aebersold and Mann (2003) Nature 422, 198-207
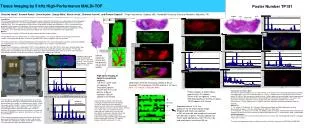
Tim e Voyager System Components 1.Sample + matrix dried on target plate 4. Ions are accelerated by an electric field to the same kinetic energy; they separate according to mass as they drift thru the field-free region of the flight tube 20 - 25 kV Flight tube 2. Target is introduced into high vacuum chamber High vacuum High voltage 5. Ions strike the detector at different times depending on the mass/charge ratio 3. Sample is irradiated with laser, clock starts to measure time-of-flight Pulsed laser • . 6. A data system controls instrument parameters, acquires signal vs. time, and processes the data
Mass analyzers measure the mass of ions • Operate under high vacuum (keeps ions from bumping into gas molecules), typically 10-7 – 10-8 torr • Actually measure mass-to-charge ratio of ions (m/z) • Several kinds exist: for bioanalysis, quadrupole and time-of-flight (TOF) are most used. • Ions are detected by devices that convert the arrival of ions into emitted electrons or photons and amplify this signal, e.g., Microchannel Plates, Photomultipliers.
MALDI:Matrix Assisted Laser Desorption Ionization Sample plate hn • Sample (M) is mixed with excess matrix (X) and dried on a MALDI plate. • The plate is loaded onto the sample stage in the Ion Source to Mass Analyzer Sample & Matrix GroundGrid
MALDI:Matrix Assisted Laser Desorption Ionization Laser hn • Laser flash produces matrix neutrals (X), matrix ions (XH)+, (X-H)- , and sample neutrals (M). • 3. Sample molecules are ionized by proton transfer from matrix ions: • XH+ + M X + MH+. • X-H- + M X + M-H-
MALDI:Matrix Assisted Laser Desorption Ionization hn • Ion Extraction: High voltage is applied to the sample plate, accelerating ions out of the Ion Source into the Flight Tube. MH+ +20 kV
Time-of-Flight Mass Analyzer Ion Source Flight Tube 20-25 kV Detector + + Principle: If ions are accelerated with the same potential at a fixed point and a fixed initial time and are allowed to drift, the ions will separate according to their mass to charge ratios.
+ + Time-of-Flight Mass Analyzer Ion Source Flight Tube Detector + The ions enter the flight tube with the lighter ions travelling faster than the heavier ions to the detector
+ + Time-of-Flight Mass Analyzer Ion Source Flight Tube Detector + The lighter ions strike the detector before the heavier ions. This “time of flight” (TOF) can be converted to mass
Ions are detected with a Microchannel Plate + -1000 V -100 V D= 6-25 u Primary Ion from Flight Tube L
Ions are detected with a Microchannel Plate + -1000 V -100 V D= 6-25 u L
Ions are detected with a Microchannel Plate + -1000 V -100 V D= 6-25 u e- L
Ions are detected with a Microchannel Plate + -1000 V -100 V D= 6-25 u e- e- e- e- L
Ions are detected with a Microchannel Plate + -1000 V -100 V D= 6-25 u e- e- e- e- L
Ions are detected with a Microchannel Plate e- e- e- e- e- e- e- e- + -1000 V -100 V D= 6-25 u e- e- e- e- ~103 Amplification L
+ High Current Detector schematic Used in Linear Mode Fast scintillator Microchannel plate Lens Photomultiplier tube Signal out to Digitizer Ion in Flight Tube
What is a Reflector TOF analyzer? Reflector Detector Flight Tube Ion Source + Reflector (Ion Mirror) The reflector acts as an ion mirror, extending the flight length without increasing the instrument size. The reflector also compensates for the initial energy spread of ions having the same mass. The result is improved resolution.
Calibration of the mass scale The mass-to-charge ratio of an ion is proportional to the square of its time of flight in the analyzer (“drift time”). t = Drift time L = Drift length m = Mass K = Kinetic energy of ion z = Number of charges on ion
Important performance factors • Mass accuracy: How accurate is the mass measurement? • Resolution:How well separated are the peaks from each other? • Sensitivity:How small an amount can be detected / analyzed?
Resolution and Mass Accuracy Mass accuracy (ppm) = observed mass - theoretical mass x106 theoretical mass Mass Apex R = 100% FWHM FWHM 50% 990 995 1005 1010 1020 1030 1040 Mass Assignment m/z (1000 Da)
DE-STR Res = 18100 8000 6000 DE-PRO Res = 14200 4000 Counts DE-RP Res = 4500 2000 0 2840 2845 2850 2855 Mass (m/z) Higher Resolution means better Mass Accuracy 15 ppm error 24 ppm error 55 ppm error
Voyager™ Product Line • Voyager-DE™ Biospectrometry™ Workstation • Benchtop linear with Delayed Extraction • Voyager-DE™ PRO Biospectrometry™ Workstation • Benchtop with reflector for increased performance • Voyager-DE™ STR Biospectrometry™ Workstation • Floor standing with reflector for ultimate performance and flexibility
Features of MALDI-TOF MS • Soft ionization - biomolecules remain intact • Broad mass range - analyze a wide variety of biomolecules (40 Da to > 400 KDa) • Mixtures are OK - little need for purification • High sensitivity • Data is easy to interpret • Buffers and salts have small effect • Fast • Easy to use and maintain
US Technical Support 800-899-5858 Mass Spec: 508-383-7779 Michelle Chen, Jing DeNore e-mail: tsupport@appliedbiosystems.com Tech Support Fax: 508-383-7212 or 508-383-7855 Front Desk: 508-383-7700 Sales/Service: 800-831-6844, option 1 (Foster City, CA) Website: www.appliedbiosystems.com