Download
1 / 21
210 likes | 372 Vues
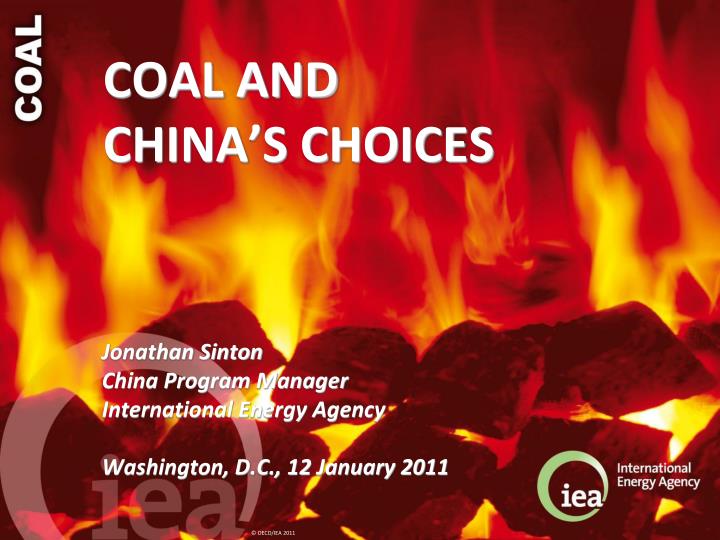
COAL AND CHINA’S CHOICES. Jonathan Sinton China Program Manager International Energy Agency Washington, D.C., 12 January 2011. Coal, long the big story, is now even bigger. 2010 was a big year for Chinese coal imports. China’s coal imports are a small portion of total consumption.

E N D
COAL AND CHINA’S CHOICES Jonathan Sinton China Program Manager International Energy Agency Washington, D.C., 12 January 2011
China’s coal imports are a small portion of total consumption Mt coal
China may have lots of coal, but it’s no longer dirt cheap Monthly spot coal prices Qinhuangdao imports CIF
Center of production moving west • Getting deeper • Quality an issue • Water too • Transport very stretched source: China5E
Longer-term: WEO 2010 scenarios • Global energy scenarios to 2035 • New Policies Scenariois the central scenario in WEO-2010 • assumes cautious implementation of recently announced commitments & plans, even if yet to be formally adopted • provides benchmark to assess achievements & limitations of recent developments in climate & energy policy • Current Policies Scenariotakes into consideration only those policies that had been formally adopted by mid-2010 • equivalent to the Reference Scenario of past Outlooks • The 450 Scenariosets out an energy pathway consistent with the goal of limiting increase in average temperature to 2OC
World primary energy demand by fuelin the New Policies Scenario Other renewables 18 000 Mtoe Biomass 16 000 Hydro 14 000 12 000 Nuclear 10 000 Gas 8 000 Oil 6 000 Coal 4 000 WEO-2009 Total:Reference Scenario 2 000 0 1980 1990 2000 2010 2020 2030 2035 Fossil fuels maintain a central role in the primary energy mix in the New Policies Scenario, but their share declines, from 81% in 2008 to 74% in 2035
Recent policy commitments, if implemented, would make a difference World primary energy demand by region in the New Policies Scenario 18 000 Rest of world Mtoe 16 000 China 14 000 OECD 12 000 10 000 WEO-2009: 8 000 Reference Scenario 6 000 4 000 2 000 0 1990 1995 2000 2005 2010 2015 2020 2025 2030 2035 Global energy use grows by 36% in 2008-2035, with the OECD share of world demand falling from 44% today to 33% in 2035
China primary energy demand by fuel in the New Policies Scenario 4 000 Mtoe Other renewables 3 500 Biomass 3 000 Hydro 2 500 Nuclear 2 000 Gas 1 500 Oil 1 000 Coal 500 WEO-2009 Total:Reference Scenario 0 1980 1990 2000 2010 2020 2030 2035 Total primary energy demand in China grows at 2.1% per year on average in 2008-2035, an overall increase of 75%
The power and industry sectors remainkey drivers of global coal demand Change in primary coal demand by sector and region in New Policies Scenario, 2008-2035 OECD Power generation China India Industry Indonesia Other non-OECD Coal-to-liquids Other* - 750 - 500 - 250 0 250 500 750 1 000 1 250 Mtce Demand in power generation accounts for almost 60% of the increase in global coal demand, while another 30% of the demand growth comes from the industry sector
Coal remains the backbone of global electricity generation Coal-fired electricity generation by region in the New Policies Scenario 12 000 China TWh India 10 000 Other non-OECD 8 000 OECD 6 000 4 000 2 000 0 1990 2000 2010 2020 2030 2035 A drop in coal-fired generation in the OECD is offset by big increases elsewhere, especially China, where 600 GW of new capacity exceeds the current coal-fired capacity of the US, EU & Japan
The 450 Scenario: A roadmap from 3.5C to 2C • The 450 Scenario sets out an energy pathway consistent with limiting the increase in temperature to 2C • Assumes vigorous implementation of Copenhagen Accord pledges to 2020 & much stronger action thereafter • The failure of the Copenhagen Accord pledges: • As many lack transparency, there is 3.9 Gt of uncertainty over the level of abatement pledged to 2020 • As many lack ambition, the cost of achieving the 2 C goal has increased by $1 trillion in 2010-2030 compared with WEO-2009
The 450 Scenario: Abatement by technology World energy-related CO2 emission savings by technology in the 450 Scenario relative to the New Policies Scenario 45 Share of cumulative abatement between 2010-2035 Gt Current Policies Scenario 42.6 Gt 7.1 Gt 40 Efficiency 50% New Policies Scenario Renewables 18% 35.4 Gt 35 Biofuels 4% Nuclear 9% 13.7 Gt 30 CCS 20% 25 450 Scenario 21.7 Gt 20 2008 2015 2020 2025 2030 2035 In moving from the New Policies Scenario to the 450 Scenario, more expensive abatement options such as CCS play a growing role
China abatement in the 450 Scenario China energy-related CO2 emission savings in the 450 Scenariorelative to the New Policies Scenario 13 Gt Current PoliciesScenario Share of cumulative abatement between 2010-2035 12 12.6 Gt 11 2.4 Gt New PoliciesScenario Efficiency 50% 10 10.1 Gt Renewables 18% 9 Biofuels 1% 8 Nuclear 8% 5.0 Gt 7 CCS 23% 6 450 Scenario 5 5.2 Gt 4 2008 2015 2020 2025 2030 2035 In moving from the New Policies Scenario to the 450 Scenario, China starts to rely more on CCS as room for further abatement from lower-cost options becomes limited
Power generation in China in the 450 Scenario Share of China electricity generation by type and scenario 100% Low-carbon generation in the NPS Additional low-carbon generationin 450 Scenario 80% 60% Fossil-fuel fired generation in the 450 Scenario 40% 20% 0% 2010 2015 2020 2025 2030 2035 Low-carbon technologies account for 78% of China’s power generation by 2035 in the 450 Scenario, up from 19% today
Bigger and more efficient power plants in non-OECD Coal-fired electricity generation by technology and region in the New Policies Scenario 100% 45% Coal with CCS Efficiency 80% 41% IGCC 60% 37% Share of coal generation Ultrasupercritical 40% 33% Supercritical 20% 29% Subcritical 0% 25% Average efficiency 2008 2020 2035 2008 2020 2035 (right axis) OECD Non-OECD The average efficiency of coal-fired generation plants in the non-OECD countries risesfrom 33% in 2008 to 40% by 2035
WEO 2010 Implications for China • China's role in global energy is set to expand further & its policies will have major implications for global energy trends & prospects for limiting climate change • A greater role for gas in China could contribute greatly to reducing CO2 emissions • China's role as leader in manufacturing, deploying—and increasingly in developing—low-carbon technologies can drive down costs, to the benefits of all countries • Growing interconnectedness & China's increasing weight in the energy market links its energy security to global energy security
Courtesy: IEA Clean Coal Centre Typical, old 200 MWe plant in China
Huaneng Qinbei Power Plant 2x600MWe SC Huaneng Yuhuan Power Plant 2x1000MWe USC Shanghai Waigaoqiao Power Plant 2x900MWe SC + 2x1000MWe USC Shandong Zouxian Power Plant 2x600MWe + 2x1000MWe Selection of supercritical (SC) and ultra-supercritical (USC) power plants constructed in China over the past decade