Download
1 / 67
670 likes | 749 Vues
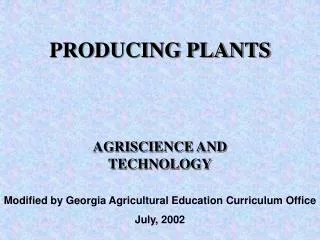
Objectives and Challenges of Goal-oriented Landscape Design. Bryan Watts and Mike Wilson Center for Conservation Biology College of William and Mary http://www.ccb-wm.org. Producing information that enables conservation. Strategy Development. Implementation. Continental Integration &

E N D
Objectives and Challenges of Goal-oriented Landscape Design Bryan Watts and Mike Wilson Center for Conservation Biology College of William and Mary http://www.ccb-wm.org Producing information that enables conservation
Strategy Development Implementation Continental Integration & Strategy Continental Action BCR / Landscape Assessment BCR / Landscape Management & Restoration Species / Habitat Assessment Species / Habitat Management & Restoration Species / Habitat Information Needs Assessment Targeted Species / Habitat Monitoring BCR / Landscape Information Needs Assessment BCR-specific Monitoring Continental Monitoring Infrastructure Continental Monitoring Program Continental Bird Conservation Lattice Conservation Monitoring
General Management Framework Resource Constraints Single Species Systems Multiple Species Systems
Conservation Planning National Planning Conservation Strategy Colonial Shorebird Waterfowl Waterbird Plan Plan Plan Translation Regional Adaptive Monitoring Planning Regional PIF Synthesis Plan Integrated Regional Plan MABCI PLAN Conservation Action Status Action Conservation Evaluation Plan Goals Local Conservation Action Response
Population Projection STATUS EVALUATION (Conceptual Model) Habitat Requirements Habitat Assessment Ecological Modifiers Population/Goal Comparison Management Options Action Plan
Population Projection STATUS EVALUATION (Grasshopper Sparrow) Grassland 18,884 ha Sub-type Density Patch Area 150 k Population Goal Conservation Design ? 75 k Status
Conservation Benefit Management Habitat Management H1 Conservation Benefit H2 Management
Species-Landscape Compatibility Goal-Oriented Land Management(For Wildlife Species) Suite of Required Resources
FUNDAMENTAL QUESTIONS What is our objective (goal)? What management tools should we use? What resources are available to us? What criteria are we going to use to evaluate strategy?
Habitat Availability Winter Conditions Physiological Stressors Predation Food Availability Competition Contaminants Integrated Responses Ecological Factors Influencing Populations Reproductive Success Survivorship Population Response
Legislative Protection Reduce Contaminants Improve Habitat Quality Predator Control Protect Habitat Control Competitors Create Habitat Integrated Responses Management Actions Influencing Populations Reproductive Success Survivorship Population Response
Management Actions are Habitat Specific Habitat 4 Habitat 3 Habitat 2 Habitat 1 1 2 3 4 5 6 7 8 9 10 11 12 Pool of Management Actions
Attributes of Management Actions Benefit Cost 9 10 11 12 Population Increase Money Land Time Metrics
m09 m10 m11 m12 Benefits (m9 + m10 + m11 + m12) Costs (m9 + m10 + m11 + m12) Management Strategy
Population Goal Bird Population Beginning Condition Management Trajectories
m09 m10 m11 m12 Management Strategy
Cost Conservation Benefit Random Management Walk Criteria Maximize conservation benefit Minimize costs
Design Principles 1) produce maximum benefit with the most efficient combination of resources. (universal)
Restoration Costs Landscape to Landscape Variation in Beginning Condition Population Goal Cost Cost Beginning Condition Bird Population Beginning Condition Landscape 1 Landscape 2
Attaining vs Sustaining Goals Maintenance Costs Landscape Equilibrium
Maintenance Costs Landscape Equilibrium Maintenance Costs Attaining vs Sustaining Goals
Attaining vs Sustaining Goals Restoration Cost Long term Maintenance Costs
Design Principles 1) produce maximum benefit with the most efficient combination of resources. 2) consider both restoration and long-term maintenance costs.
General Management Framework Resource Constraints Single Species Systems Multiple Species Systems
Management Potential/Constraints Total Land Lost to system (e.g. urbanization) Natural constraints (e.g. wetlands) Use constraints (e.g. cemeteries, monuments) Open to Management
Management Limits Absolute Management Limit Total Area – Losses and Constraints Bird Population Practical Management Limit Beginning Condition
Management Limits Population Goal Achievable (within management limits) Absolute Management Limit Bird Population Practical Management Limit Population Goal Beginning Condition
Management Limits Population Goal not Achievable (exceeds management limits) Absolute Management Limit Population Goal Bird Population Practical Management Limit Beginning Condition
General Management Framework Resource Constraints Single Species Systems Multiple Species Systems
Protecting Land for Bald Eagles in the lower Chesapeake Bay What is our objective (goal)? Protect land for 120 pairs What management tools should we use? Acquisition What resources are available to us? To be determined What criteria are we going to use to evaluate strategy? Maximize benefit, minimize cost
Distribution Constraints No Is site within 3 km of 250 m channel? Yes No Is there < 5 houses within 200 m? Yes Unsuitable Is there < 10 houses within 400 m? No Yes Is there forest cover within 200 m? No Habitat Quality Rating Yes 100 Very Good Results 67 Discriminant Function Model Good 34 Acceptable 21 Questionable 0 Bald Eagle Habitat Suitability Model (Chesapeake Bay)
181,601 ha 181,601 ha Bald Eagle Management Limits Total Land 665,079 ha Lost to system (e.g. urbanization) 51% 326,419 ha 22% Natural constraints (e.g. wetlands) ?% Use constraints (e.g. cemeteries, monuments) Open to Management
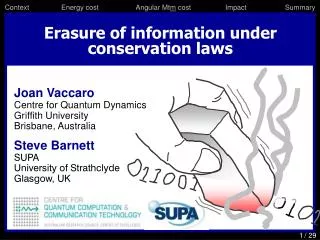
Salinity Gradient (Lower Chesapeake Bay)
Bald Eagle Breeding Density by Salinity 1.6 1.2 0.8 Breeding Density (Pairs/10 km Shoreline) 0.4 Tidal Fresh Oligohaline 0.0 Mesohaline 1977 1979 1981 1983 1985 1987 1989 1991 1993 1995 1997 1999 2001 Polyhaline 1978 1980 1982 1984 1986 1988 1990 1992 1994 1996 1998 2000 2002 Survey Year
BALD EAGLE BREEDING DENSITY BY SALINITY 3.6 A A 3.0 2.4 B B Breeding Density (Pairs/10 km shoreline) 1.8 1.2 Mean+SD 0.6 Mean-SD Mean+SE Mean-SE 0.0 Mean TF OH MH PH Salinity Zone
Eagle Benefit H2(Salinity > 1 ppt) Eagle Benefit H1(Salinity < 1 ppt) Salinity and Eagle Benefit/Unit Area
Management Limits Population Goal Achievable (within management limits) 660 Practical Management Limit Bird Population 200 (80 achieved) Protection Goal Beginning Condition
Land Acquisition Cost Benefit by Jurisdiction 10 8 6 Cost per Hectare (dollars X 100,000) 4 2 0 0 10 20 30 40 50 60 Benefit (potential eagle territories)
Cost of Land Protection for Bald Eagles 1600 1400 1200 1000 Accumulated Cost (millions of dollars) 800 600 400 Price Tag 200 0 0 100 200 300 400 500 Pairs Protected
General Management Framework Resource Constraints Single Species Systems Multiple Species Systems
Species Suites and Habitats Habitat 1 Habitat 4 Sp1 Sp2 Sp3 Sp4 Sp5 Sp6 Sp1 Sp2 Sp3 Sp4
Management Potential/Constraints Total Land Lost to system (e.g. urbanization) Natural constraints (e.g. wetlands) Use constraints (e.g. cemeteries, monuments) Open to Management
Land Requirements for Suite Sp3 Population Goal Sp5 Population Goal Sp6 Population Goal Land Requirements Sp1 Population Goal Sp2 Population Goal Sp4 Population Goal
Management Limits Population Goals Achievable (within management limits) Absolute Management Limit Collective Land Requirement Practical Management Limit Collective Land Requirement (H1 + H2…) Beginning Condition
Management Limits Population Goals not Achievable (exceed management limits) Absolute Management Limit Collective Land Requirement (H1 + H2…) Collective Land Requirement Practical Management Limit Beginning Condition