Download
1 / 51
520 likes | 630 Vues
SOVAP - BOS (Bolometric Oscillation Sensor) DAVOS Scientific meeting. A1: calibration A2: validation A3: Science products determination A4: Routine and non-routine tasks A5: Scientific community interfaces. Royal Observatory of Belgium. E 2. A. E 1. C 2. C 1. Radiative. Conductive.

E N D
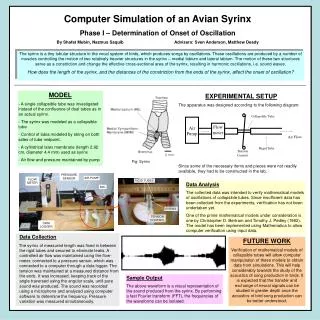
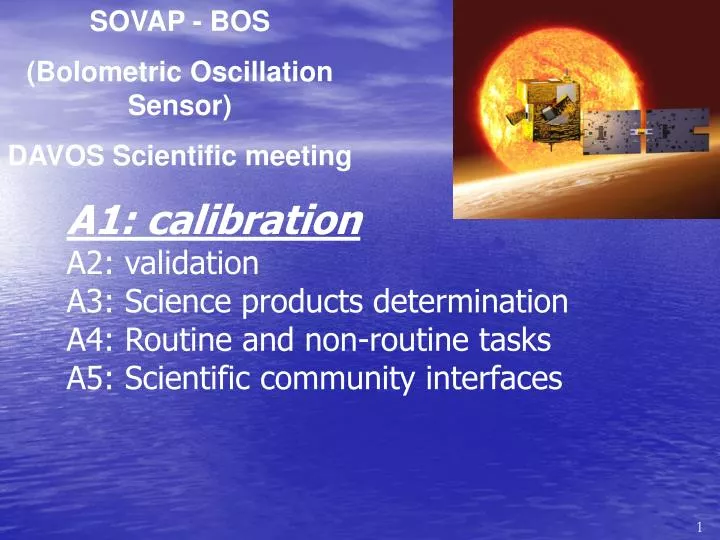
SOVAP - BOS (Bolometric Oscillation Sensor) DAVOS Scientific meeting A1: calibrationA2: validationA3: Science products determinationA4: Routine and non-routine tasksA5: Scientific community interfaces
Royal Observatory of Belgium E2 A E1 C2 C1 Radiative Conductive Concept Repartition of flows
Coatings Flat absorber :black painting (αs = 0.98, ε = 0.85) Solar reflector :White silicate painting (αs = 0.13, ε = 0.90) Black Painting White Painting Temperature of balance = 25°C : Absorbing surface = 21 % of total surface
Theoretical transfer function Picard/BOS electronics B-USOC 18-19 juin 2009
Theoretical transfer function Picard/BOS electronics void BOS_V2T(double V1,double V2,double *T_OUT) { double G11,G12,Vamp11,Vamp12,Vpp1,Vpm1,Rt1,T1; double G21,G22,Vamp21,Vamp22,Vpp2,Vpm2,Rt2,T2; double Valim; Valim = 8; //********************************************* Vamp12=V1; //********************************************* G11=1; G12=1+49400/R13; Vamp11=Vamp12/(Kmod*G12); Vpp1=Valim/(1+R19/R18); Vpm1=(G11*Vpp1-Vamp11)/G11; Rt1=Vpm1*R15/(Valim-Vpm1); T1=beta*T0/(T0*log(Rt1/R0)+beta); //********************************************* Vamp22=V2; //********************************************* G21=1; G22=1+49400/R23; Vamp21=Vamp22/(Kmod*G22); Vpm2=Vpm1; Vpp2=(Vamp21+Vpm2*G21)/G21; Rt2=Vpp2*R29/(Valim-Vpm2); T2=beta*T0/(T0*log(Rt2/R0)+beta); //********************************************* *T_OUT++=T1; *T_OUT =T2; } #include <stdio.h> #include <stdlib.h> #include <math.h> #define Kmod 0.667 // #define beta 4143 // #define T0 298.15 // #define R0 100000 #define R15 75000 #define R13 75000 #define R18 100000 #define R19 100000 #define R23 10000 #define R29 82000 void BOS_V2T(double V1,double V2,double *T_OUT); int main(int argc, char *argv[]) { double T12_OUT[2],*T12_ptr; T12_ptr=&T12_OUT[0]; BOS_V2T(2,0,T12_ptr); printf("%lf\r\n",T12_OUT[0]); printf("%lf\r\n",T12_OUT[1]); system("PAUSE"); return 0; }
SOVAP - BOS (Bolometric Oscillation Sensor) A1: calibrationA2: validationA3: Science products determinationA4: Routine and non-routine tasksA5: Scientific community interfaces
Royal Observatory of Belgium 1% of modulation = 1000 lux = 500Hz Noise level with a 50 sec low pass filter, is about 1/10Hz Corresponding to a dynamic range of 500.000/1
Figure 4: Ramp and sin for scale factor Figure 5: T1 and T1-T2 Ramp and sin for scale factor T1 and T1-T2
Royal Observatory of Belgium Experiments
SOVAP - BOS (Bolometric Oscillation Sensor) A1: calibrationA2: validationA3: Science products determinationA4: Routine and non-routine tasksA5: Scientific community interfaces
The projection of PICARD satellite orbit. Here, we plotted the position of PICARD from 17:33 to 21:25 on July 11, 2010. This period is overlap with the solar eclipse. Red dashed line is from 17:33 to 18:41; Blue dashed line is from 18:41 to 20:12; Black dashed line is from 20:12 to 21:15. Two dark brown line marks the north and south limits of the greatest eclipse.
38 days records calibrated records, the linear trend has been removed.
99 Minutes 3 Minutes Amplitude Fourier Spectrum of T1 and T2 computed using 38 days’ records
38 days records calibrated records, the linear trend has been removed. The Sub panel plotted 240 minutes data.
Three hours T1 measurements plotted on the map. The geocentric position was computed with the predicted orbit using WGS84
Three hours T2 measurements plotted on the map. The geocentric position was computed with the predicted orbit using WGS84