Download
1 / 36
510 likes | 1.28k Vues
CHROMATOGRAPHY Basic concepts & Definitions Applied Theory Chromatography Matrix Separation Mechanisms HPLC Ref: Tietz Fundamentals, Chapter 8 Tietz Textbook, Chapter 8 Wilson & Walker (1995), Practical Biochemistry,

E N D
CHROMATOGRAPHY • Basic concepts & Definitions • Applied Theory • Chromatography Matrix • Separation Mechanisms • HPLC Ref: Tietz Fundamentals, Chapter 8 Tietz Textbook, Chapter 8 Wilson & Walker (1995), Practical Biochemistry, Chapter 10
INTRODUCTION • Term by Russian scientist Tswett • Generally refers to differential separation of components in a sample by distribution between two phases • 60% of all analysis world-wide done by this method • Used for qualitative & quantitative purposes
1. BASIC CONCEPTS & DEFINITIONS • Separate & resolve a mixture -> individual components (solutes) • Introduce sample into a mobile phase -> MP passes thru a bed of support particles (stationary phase) • MP carries sample into & through SP • solutes with greater solubility in the MP or • less affinity for the SP travel faster than those that do not
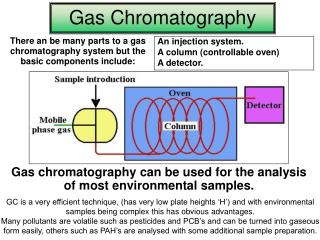
Mobile phase • gas in gas chromatography (GC) • liquid in liquid chromatography (LC) • Stationary phase • planar chromatography: spread on a flat surface eg. TLC, paper • column chromatography: contained in a column • Other techniques: • HPLC: high-performance column with LC • GC-MS: combine GC with mass spectrometry • LC-MS
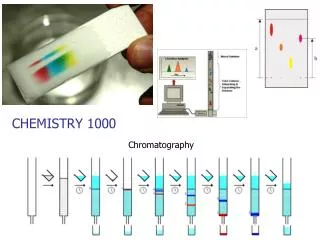
Column Chromatography • column effluent passed thru a detector -> detects the separated zones of solutes -> zones appear as peaks -> measure peak: height, width, area (Fig 8-1) • Planar Chromatography • separated zones appear as individual spots Homework: Read & understand – external calibration & internal calibration
2. APPLIED THEORY • Goal: to separate mixture => relative migration rates must be different => no overlapping of band widths (spots) • Resolution (Rs) Measure of the degree of separation of two solute bands relative to band widths Rs = Vr(B) – Vr(A) where Vr = retention volumes w(A) + w(B) w = peak widths (vol) 2 Rs < 0.8 => inadequate separation Rs > 1.25 => baseline separation (Figs 8-2, 8-3)
Rs can be increased by a. Improving column efficiency b. Increasing column capacity c. Changing selectivity of column a. Efficiency (N > 5000) • Measure of diffusion effects in a column • N = number of theoretical plates • Plate: length for one equilibration of solute to occur between the SP & MP • Factors affecting efficiency: length of column, X’tics of SP particles, MP viscosity, temperature
b. Capacity Factor (k’) • Ratio of no. of solutes on SP relative to those in MP • k’ = (tr – to) where tr = retention time of solute to to = time unretained solutes emerge fr column • Solutes with k’ < 2 => solutes slight retained k’ = 2 to 6 => optimal separation • Higher k’ values • Improve separation but • Longer elution times • Broader solute bands Fig 8-4
c. Selectivity Factor () • Measure of separation betwn peak of two solutes (Fig 8-4) • Ratio of capacity factors of the two solutes = k’(B)/k’(A) = 1.0 => solute not separated = 1.01 => difficult to separate = 1.05 => reasonable easy to separate > 1.10 => easy to separate • Change by changing • column temp • chemical & physical nature of SP • sample chemistry
3. CHROMATOGRAPHY MATRIX • Solid material to support SP • Should have following properties • High mechanical stability • Good chemical stability • Functional groups • High capacity • Available in range of particle sizes • Porous structure of correct size & shape - Inert surface
Types of Matrix a. Agarose • Chain of D-galactose & 3,6-anhydro-1-galactose • Unbranched polysaccharide • Cross-link with agents eg. 2,3-dibromopropanol => form gels that are stable fr pH 3 - pH 14 • Have good flow properties • Highly hydrophilic => must not allow to dry out • Commercial examples: Sepharose; Bio-Gel A
b. Cellulose • Linear polysaccharide of -1-4 linked glucose units • Cross-linked with epichlorohydrin • Available in bead, microgranular, fibrous forms • Good pH stability & flow properties • Highly hydrophilic c. Polyacrylamide • Polymer of acrylamide cross-linked with N,N’-methylene-bisacrylamide • Stable from pH 2 – pH 11 eg. Bio-Gel P
d. Dextran • Polysaccharide of -1-6-linked glucose units • Cross-linked with epichlorohydrin • Less stable than cellulose matrices to acid hydrolysis • Hydrophilic • Stable from pH 2 - pH12 • Produced by bacteria • Commercial example: Sephadex
e. Polystyrene • Polymer of styrene cross-linked with divinylbenzene • Good stability over all pH ranges • Commonly used for exclusion & ion-exchange C • Relatively low hydrophilicities f. Silica • Polymer from orthosilicic acid • Has many silanol (Si-OH) groups • Stable only betwn pH3 – pH 8 • Chemically inert but dissolves above pH8 (Table 3)
4. SEPARATION MECHANISMS Separation of analyte mixtures can be affected by types of chromatography: • Ion-exchange • Steric Exclusion/Gel Filtration • Adsorption • Partition • Affinity
A. Ion-Exchange Chromatography • Separate analytes by differences in sign & magnitude of ionic charge • Selectively elute ionic analytes from ion-exchange resins by varying pH & ionic strength of MP • Clinical applications: • deionization of water • separation of hemoglobin variants, isoenzymes • analysis of cpds • Matrix has covalently bonded functional groups (FG) -> negatively or positively charged
- Na+ i. Cation/Acidic Ion -exchange resins • FG –vely charged => adsorb cations (eg. Na+, H+) • Strongly acidic groups eg. sulfonate or • Weakly acidic groups eg. carboxylate, CM ii. Anion/Basic Ion-exchange resins • FG +vely charged => adsorb anions (eg. OH-, Cl-) • Strongly basic groups eg. TEAE, TAM or • Weakly basic groups eg. AE, DEAE + OH-
Analytes eg. Proteins • Have side chains => +vely or –vely charged • Positive charge fr : His, Lys, Arg, N-terminal amines • Negative charge fr: Asp, Glu, Cys, C-terminal carboxyl • Net charge on Prot: relative numbers of +ve & -ve charges at particular pH • pH where no. +ve charges = no. –ve charges => no net charge => isoelectric point (pI) • pI betwn 5 – 9 for most proteins • pH > pI => proteins have net –ve charge • pH < pI => overall charge is +ve
Ion-Exchange Mechanism i. Diffusion of charged molecule to the exchanger surface ii. Diffusion of the charged molecule thru the matrix structure to exchange site iii. Exchange of ions at exchange site iv. Diffusion of exchanged ion to surface v. Elution of charged molecules using buffers
Buffers used in Elution • Different pH from sample buffer • Same pH but different ionic strength • Different pH from sample buffer & greater ionic strength • Same pH & ionic strength but add cation of greater affinity (Fig 8-5, Fig 18)
B. Steric Exclusion C/Gel Filtration • Separation of molecules based on • Molecular size • Molecular shape & hydration • Use porous beads in SP: • Cross-linked dextrans (Sephadex) • Agarose (Sepharose) • Polyacrylamide (Bio-Gel) (Table 1) • Mixture of sample introduced to matrix with defined pore size (Table 10.4)
Support with pore sizes allow • Small molecules penetrate beads => pass thru column at slower rate • Large molecules will pass thru interstitial space => appear in eluent first • Intermediate molecules elute in betwn large & small molecules (Fig 8-6) • For biological macromolecules eg. viruses, proteins, enzymes, hormones • Purification • Determination of molecular weights
Distribution Coefficient (Kd) • Distribution of solute betwn SP & MP • Kd = concn in SP/concn in MP Kd = 0 => molecule is large => no access to pores Kd = 1 => molecule is small => complete access to pores Kd > 0 < 1 => molecule enter some but not all pores • To separate protein with relatively close MW range => choose matrix where molecule has Kd > 0 < 1
Kav(fraction of pore vol accessible to molecule) • Elution volume (Ve) of solute dependent on • Kd • volume of pore (Vp) & • volume of external gel matrix (Vo) Ve = Vo + Kd. Vp => Kd = (Ve – Vo)/ Vp Assuming Vp = Vt – Vo where Vt = total vol of column & Vo = vol reqd to elute large excluded molecule Then Kav = Ve – Vo Vt – Vo
Determination of Molecular Weight • Elution of globular protein is approximately a linear function of log MW • Construct calibration curve • Plot Kav values vs log MW • Run unknown sample; note Ve and Kav • Extrapolate from standard curve to obtain MW of unknown
C. Affinity Chromatography • Based on interactions between biochemical species eg. enzyme-substrate, hormone-receptor, antigen- antibody, charge-transfer complexes • Can purify compound from complex mixtures eg. • Separate proteins & antibodies • Glycated Hb from Hb • LDL & VLDL from lipoproteins • Specific cell surface receptors
Method • Choose appropriate ligand: interacts with the protein/component of interest • Immobilize ligand onto matrix • directly or • via a spacer • Interaction between analyte with ligand • Elute analyte in pure form (Fig. 8-7)
Preparation of Affinity Adsorbents • Selection of Matrix b. Selection of Spacer Arms c. Selection of Ligand d. Attachment of Ligand to Matrix
a. Selection of Matrix • High degree of porosity • Chemically stable; physically rigid • Withstand pH & temperature changes • Inert to non-specific protein binding • Easily coupled to ligand Eg. agarose, cross-linled dextrans, polyacrylamide, cellulose, polystyrene
b. Selection of Spacer Arms Purpose: i. To distance ligand from matrix ii. Make small ligands accessible • Ideal length of 6-10 methylene groups • Two functional groups: • one to attach to matrix • another to attach to ligand
c. Selection of Ligand • Specific: mono- or group-specific (Table 10.5) • Bind reversibly with protein • Stable during immobilization, operation, cleaning d. Attachment of Ligand to Matrix • Treat matrix with coupling reagents • CNBr - Bisepoxide • Diclorotriazine - Trecylchloride • Reacts with hydroxyls in matrix to produce reactive group (Fig 10.14)
Elution Methods • To recover purified compound from ligand with minimum denaturation • Protein-ligand interaction: ionic or covalent • Disrupt interactions by • Addition of substrate or inhibitor • pH change • Ionic strength change • Addition of chaotropic agents (Fig. 10.13)
5. HIGH PERFORMANCE LIQUID CHROMATOGRAPHY (HPLC) • LC: Separate compounds by pumping a liquid MP through a column SP • HPLC: Liquid pumped through an efficient column under high pressure • Components: • Solvent reservoir - Pump • Injector - Column • Detector - Recording device (Fig 8-9)
a. Solvent Reservoir Glass bottles or flasks with: • Feedline to pump • Filter in feedline to remove particles • Gas line to purge dissolved gases • Solvent b. Pump • To aspirate MP & force it thru’ column & detector • Reciprocating pumps: flow rates bewtn 0.01 – 10mL/min • Operate in two modes: • Isocratic: single solvent thru’out run • Gradient: change solvent stepwise or continuous
c. Injectors • To introduce sample into column • Sample loop injector (Fig 16.16) • Fill position -> inject sample into external loop • Inject mode -> rotate sample loop into flowing stream of solvent -> flushing of sample into column d. Column • Chemically bonded to surface of silica particles -> Bonded-phase packings: • Mechanically & chemically stable • Have long lifetimes • Gives good performance • Small, uniform particles <20 m for high efficiency
Cont. Column • Normal-phase HPLC: • Functional groups of SP are polar relative to those of MPeg. silanol, amino, nitrile groups • Reversed-phase HPLC: • Non-polar SP eg. C18 octadecylsilane molecules e. Detectors • Many types based on physical & chemical processes: • UV & visible photometer • Fluorometer • Refractometer • Electrochemical (Table 8-3)