Download
1 / 37
890 likes | 1.74k Vues
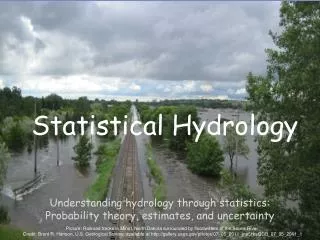
Statistical Hydrology. Read Chapter 2 (McCuen 2004) for background review Supplementary materials: Parameter Estimation: (a) Method of Moments * Product Moments (covered in CIVL181) * L-Moments (b) Method of Likelihood (covered in CIVL181). Statistical Moments.

E N D
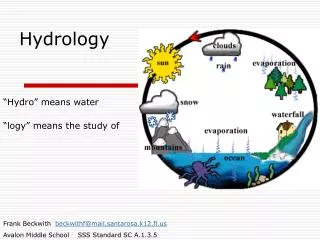
Statistical Hydrology • Read Chapter 2 (McCuen 2004) for background review • Supplementary materials: • Parameter Estimation: (a) Method of Moments * Product Moments (covered in CIVL181) * L-Moments (b) Method of Likelihood (covered in CIVL181) Statistical hydrology
Statistical Moments • Product Moments: E[Xr] - Disadvantages: (a) Sensitive to the presence of outliers; (b) Accuracy deteriorates rapidly as the order of moment increases • Probability-Weighted Moments (PWM): - Def: Mr,p,q = E{Xr [F(X)]p [1-F(X)]q } - Especially attractive when the CDF, F(x), has a closed- form expression - Special cases (a) Mr,0,0= E[Xr] (b) M1,0,q = aq ; M1,p,0 = bp Statistical hydrology
Relations between moments and parameters of selected distribution models (Tung et al. 2006) Statistical hydrology
Statistical Moments (2) • L-Moments: A linear combination of order statistics • Specifically, for the first 4 L-moments: Statistical hydrology
Graphical Representation of L-Moments Statistical hydrology
Analogy Between L- and Product-Moments Product Moments L-Moments m (mean) l1 (mean) s (stdev) l2 (L-std) Cv = s/mt2 = l2/l1 (L-Cv) Cs = m3/s3t3 = l3/l2 (L-Cs), | t3|<1 Ck = m4/s4t4 = l4/l2 (L-Ck), -0.25<t4<1 Statistical hydrology
L-moments & Distribution Parameter Relations From “Frequency Analysis of Extreme Events,” Chapter 8 in Handbook of Hydrology, By Stedinger, Vogel, and Foufoula-Georgiou, McGraw-Hill Book Company, New York, 1993 Statistical hydrology
Generalized Logistic Distribution Statistical hydrology
L-Moment Ratio Diagram Statistical hydrology
Statistical Moments (3) • Relations between L-moments and b-moments: Statistical hydrology
Sample Estimates of Statistical Moments Product Moments L- Moments Statistical hydrology
Example-1(a) Statistical hydrology
Example-1(b) Statistical hydrology
Example-1(c) Statistical hydrology
Types of Hydrologic Data Series Statistical hydrology
Return Period (Recurrent Interval) • The return period of an event is the time between occurrences of the events. The events can be those whose magnitude exceeds or equals to a certain magnitude of interest, i.e, XxT • In general, the actual return period (or inter-arrival time) between the occurrences of an event could vary. The ‘return period’ commonly used in engineering is the expected (or long-term averaged) inter-arrival time between events. • Return period depends on the time scale of the data. E.g., using annual maximum (or min.) series, the return period is year. • Return period T = 1/Pr[XxT] • To avoid misconception and mis-interpretation of an event, e.g., 50-year flood, it is advisable to use “flood event with 1-in-50 chance being exceeded annually”. Statistical hydrology
Distributions Commonly Used in Hydrologic Frequency Analysis • Normal Family – Normal, Log-normal • Gamma Family – Pearson type III, Log-Pearson type III • Extreme Value – Type I (for max. or min) - Gumbel Type II (for min) – Weibull Generalized Extreme Value Statistical hydrology
Graphical Frequency Analysis • Data are arranged in ascending order of magnitude, x(n) x(n-1) ··· x(2) x(1) • Compute the plotting position for each observed data Weibull plotting position formula: P[X≤x(m)]=m/(n+1) See other formulas • Plot x(m) vs. m/(n+1) on a suitable probability paper. (Commercially available are normal, log-normal, and Gumbel probability papers) • Extrapolate or interpolate frequency curve graphically. Statistical hydrology
Plotting Position Formulas Statistical hydrology
Example-2 (Graphical Procedure) Statistical hydrology
Normal Probability Plot Statistical hydrology
Log-normal Probability Plot Statistical hydrology
Gumbel Probability Plot Statistical hydrology
Frequency Factor Method Statistical hydrology
Frequency Factor for Various Dist’ns (1) Statistical hydrology
Frequency Factor for Various Dist’ns (2) Statistical hydrology
KT for Log-Pearson III Distribution Statistical hydrology
Analytical Frequency Analysis Procedure Statistical hydrology
Issues in Frequency Analysis • Selection of distribution and parameter estimation • Treatment of zero flows • Detection and treatment of outliers (high or low) • Regional frequency analysis • Use of historical and paleo data Statistical hydrology
Example (Analytical Procedure) Statistical hydrology
Confidence of Derived Frequency Relation Statistical hydrology
Uncertainty of Sample Quantiles Statistical hydrology
Approaches to Construct Confidence Interval Statistical hydrology
Standard Error of Sample Quantiles Statistical hydrology
(1-a)% CI for Sample Quantiles Statistical hydrology
Example (C.I.) Statistical hydrology
Hydrologic Risk • For a T-year event, P(XxT)=1/T. If xT is determined from an annual maximum series, 1/T is the probability of exceedance for the hydrologic event in any one year. • Assume independence of occurrence of events and the hydraulic structure is design for an event of T-year return period. Failure probability over an n-year service period, pf, is pf = 1-(1-1/T)n (using Binomial distribution) or pf = 1-exp(-n/T) (using Poisson distribution) • Types of problem: (a) Given T, n, find pf (b) Specify pf & T, find n (c) Specify pf & n, find T Statistical hydrology