Download
1 / 36
370 likes | 539 Vues
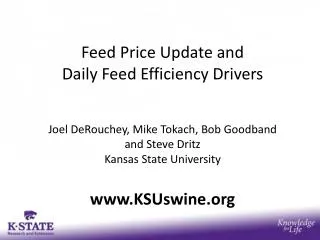
Feed Price Update and Daily Feed Efficiency Drivers. Joel DeRouchey, Mike Tokach, Bob Goodband and Steve Dritz Kansas State University. www.KSUswine.org. Presentation Outline. Feed efficiency d rivers to reduce feed cost Feed processing advancements Ingredient and diet pricing

E N D
Feed Price Update and Daily Feed Efficiency Drivers Joel DeRouchey, Mike Tokach, Bob Goodband and Steve Dritz Kansas State University www.KSUswine.org
Presentation Outline • Feed efficiency drivers to reduce feed cost • Feed processing advancements • Ingredient and diet pricing • Additional resources
Means to Reduce Feed Cost • Improved F/G = more profit? • Does the best achieving F/G producers mean they are the most profitable? – NO • Then is F/G tied to profitability? – YES, but is complicated based on individual situations. • Lowest cost diet = optimal return? • No, diet energy must be accounted for to assure growth rate is not jeopardized for optimal marketing • Another complicated decision making process
Feed Efficiency Low ADG Other factors High feed disappearance Low ADG Other factors Genetics Disease Particle size Feed wastage Genetics Diet form Temperature Feed availability Mortality Water availability Feed delivery Diet deficiency Amino acid deficiency Temperature Low Energy diets Feed Efficiency High feed disappearance
Feeder Adjustment • Poor adjustment with pans greater than 60% covered can increase feed wastage, especially in late finishing • Old feeders with poor feeder design or inability to adjust will increase wastage
Meta-analysis results (15 experiments) Nitikanchana et al., 2012
Wet-dry feeder economic analysis (IOFC, Income over feed cost) Feed cost = 306 $/ton, Carcass price = 0.88 $/lb, 1.5$/ %lean reduction Nitikanchana et al., 2012
Effective Temperature • If temperature is too low, pigs will increase their feed intake to maintain body temperature. Because the feed is going towards heat needs and not growth, feed efficiency will become poorer.
Disease or Other Stress • Disease problems that lower ADFI will greatly lower ADG. Mortality will increase F/G by about 0.015 for each 1% increase in mortality when spread across the finishing period. • Stressors are additive • Reducing stress will improve F/G
Effect of particle size and diet form on finishing pig performance (d 0 to 111; BW 57 to 288 lb) Particle size and portion ground De Jong et al., 2012
Effect of particle size and diet form on finishing pig performance (d 0 to 111; BW 57 to 288 lb) Particle size and portion ground De Jong et al., 2012
Effect of particle size and diet form on finishing pig performance (d 0 to 111; BW 57 to 288 lb) Particle size and portion ground De Jong et al., 2012
Effects of particle size on feed efficiency 1.2% per 100 microns 1.0% per 100 microns F/G Particle size, microns Particle size, microns
Every 100 microns = F/G improves by ~1.2% 7 lbs less feed/finishing pig Current $0.98/pig savings in feed cost
Grain Particle Size • F/G directly impacted by particle size of cereal grains • Research in high co-product diets: • While corn in diet is decreased, finishing pigs still respond similarly to improved F/G with reduced corn particle size • Whole diet grinding – not a benefit in meal diets • High fiber, low digestibly ingredients may be negatively affected by particle size reduction. • Takes more time/energy to grind cereals finer, however, less total tonnage is manufactured by the mill. • Testing method impacts results: • Lab using a flow agent will report a value approximately 80 µ lower then actual.
Effects of pellet quality on F/G in 30 to 70 lb pigs a F/G Nemecheck et al. 2012
Pellet quality Pellets with fines Good quality pellets Nemecheck et al. 2012
Effect of medium-oil DDGS on pig performance (d 0 to 67; BW 152 to 280 lb) 7.4% fat, 28.1% CP, 10.8% ADF, 25.6% NDF Medium-oil DDGS Graham et al., 2012
Effect of medium oil DDGS on pig performance (d 0 to 67; BW 152 to 280 lb) Medium-oil DDGS (7.4% oil) Graham et al., 2012
Effect of medium oil DDGS on pig performance (d 0 to 67; BW 152 to 280 lb) Medium-oil DDGS (7.4% oil) Graham et al., 2012
Effect of medium oil DDGS on pig performance (d 0 to 67; BW 152 to 280 lb) Medium-oil DDGS (7.4% oil) Graham et al., 2012
Variability in DDGS quality • Main issue is fat level Fat, % NE, % • Low = < 5% fat 4.0 80.0% • Medium = 6 to 9% fat 7.5 87.5% • High = > 9% fat 11.0 95.0% • Need to monitor DDGS quality or work with company that monitors DDGS quality • Ethanol plants guarantee often underestimate the true oil content – guarantee 6% but really 9% Corn DDGS quality control
Example Diets with Alternatives • Phase = 125 – 170 lb of body weight • Corn = $7.30/bu ($260/ton) • SBM, 46.5% = $474/ton • DDGS (7.5% Fat) = $220/ton • Wheat midds = $212/ton • Meat and Bone = $550/ton • Moncal P, 21% = $540/ton • L-Lysine = $0.83/lb
Effect of DDGS (0, 15, 30%) and Midds(0, 9.5, 19%) on pig performance (90 to 270 lb) Duration P > 0.38 SEM 2.54 Asmus et al., 2011
K-State Web Resources www.ksuswine.org • DDGS Calculator • Synthetic Amino Acid Calculator • Fat Analysis Calculator • Feed Budget Calculator • Feeder Adjustment Cards • Particle Size Information • Marketing Calculators • Gestation Feeding Tools
33 www.KSUswine.org
34 www.swinefeedefficiency.com
Swine Feed Efficiency, IPIC 25a: Not Always Linked to Net Income Swine Feed Efficiency, IPIC 25b: Genetic Impact Swine Feed Efficiency, IPIC 25c: Particle Size Testing Methodology Swine Feed Efficiency, IPIC 25d: Influence of Particle Size Swine Feed Efficiency, IPIC 25e: Influence of Pelleting Swine Feed Efficiency, IPIC 25f: Influence of Temperature Swine Feed Efficiency, IPIC 25g: Decision Tree Swine Feed Efficiency, IPIC25h: Influence of Market Weight Swine Feed Efficiency, IPIC 25i: Effect of Dietary Energy Swine Feed Efficiency, IPIC 25j: Influence of Ractopamine Swine Feed Efficiency, IPIC 25k: Feeder Design and Management Swine Feed Efficiency, IPIC 25l: Influence of Amino Acids Swine Feed Efficiency, IPIC 25m: Sow Feed on Whole Farm Efficiency Newly Developed F/G Factsheets www.swinefeedefficiency.com
Thank you! WWW.KSUswine.org