Download
1 / 42
420 likes | 495 Vues
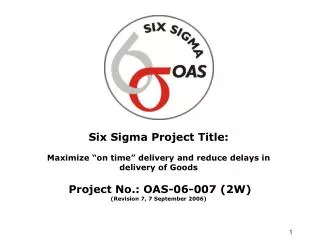
Six Sigma Project Title: Maximize “on time” delivery and reduce delays in delivery of Goods Project No.: OAS-06-007 (2W) (Revision 7, 7 September 2006).

E N D
Six Sigma Project Title:Maximize “on time” delivery and reduce delays in delivery of GoodsProject No.: OAS-06-007 (2W)(Revision 7, 7 September 2006)
Champion: Paulino P. SantiagoTeam Leader: Bryan C. CookAsst. Team Leaders: Ma. Corazon Panganiban and Manolo D. MacariolaMembers:Lorna Santillan, Eric De Leon, Janet E. PaternoHernand De Chavez and Rey Belza
DEFINE Project Title: Maximize on time delivery and reduce delays in delivery of goods • PROJECT DESCRIPTION: • OAIS-PC receives a number of complaints for the delayed delivery of goods which causes inconvenience to end user, delay implementation of projects and results in lost opportunity. • PROBLEM STATEMENT: • Delay in delivery of goods has a negative impact on customer (user section) satisfaction and results in lost of opportunity on the use of goods, or holds back the implementation of project.
DEFINE Project Title: Maximize on time delivery and reduce delays in delivery of goods • GOAL STATEMENT: • Reduce the number of delayed deliveries of goods and increase the "on time" delivery and customer satisfaction - KRA
High Level Process Map DEFINE
Output characteristics/ Project Y Relationship Matrix DEFINE
DEFINE Critical to Quality
S P O I C Customer Input Output Supplier Process CTQs DEFINE S I P O C CTQs OAIS-PC Purchase Order (PO) • Issues PO to • Supplier • 2. Receives, • acknowledges & • signs PO • 3. Process PO • 4. Issues delivery • receipt & invoice • 5. Delivers Goods • 6. Received Goods • & issue RR • 7. Check, Inspects, • accepts Goods & • signs RR Delivery of Goods Users • On time • delivery • 2. Correct Specs. • 3. Correct qty.
Time Line DEFINE Time Line Define Measure Analyze Improve Control 49 days 26 Jan.06 to 15 Mar.06 45 days 16 Mar.06 to 30 Apr.06 70 days 1 Jul.06 to 8 Sep.06 40 days 15 Dec.05 to 25 Jan.06 59 days 2 May06 to 30Jun.06
MEASURE SAMPLE Data Collection Please see attached excel worksheets for the data collected
MEASURE Process Capability for Project Y Local Deliveries
MEASURE Process Capability for Project Y Local Deliveries Distributioncurve
Process Capability for Project Y Local Deliveries MEASURE
Process Capability for Project Y Indent Deliveries MEASURE
Process Capability for Project Y Indent Deliveries MEASURE Distributioncurve
Process Capability for Project Y Indent Deliveries MEASURE
Pareto Chart for no. of delayed Delivery per Supplier MEASURE
Pareto Chart for cumulative no. of days of delayed Delivery per Supplier MEASURE
Pareto Chart for no. of delayed Delivery per Supplier MEASURE
Pareto Chart for cumulative no. of days of delayed Delivery per Supplier MEASURE
Cause-and-Effect Diagram ANALYZE Type of Supplier Procedure / Policy Local AO & AC Origin of goods Indent Penalty Clauses manufacturer Lack of supplier’s management policy distributor retailer Timely delivery of goods Commitment of the supplier to delivery within the terms of PO Lack of follow-up or monitoring Off-the-shelves Miscommunication Custom made Fax Machine Changes in specs after delivery Computer Lack or not clear specs. Softwarei.e. Oracle System Specs. & type of goods Technology & Communication
Cause-and-Effect Diagram N N N N N N N N N N N N N C C C C C C C ANALYZE Type of Supplier Procedure / Policy Local AO & AC Origin of goods Indent Penalty Clauses manufacturer Lack of supplier’s management policy distributor retailer Timely delivery of goods Commitment of the supplier to delivery within the terms of PO Lack of follow-up or monitoring Late submission of shipping docs Changes in specs after delivery Miscommunication Custom made Fax Machine Off-the-shelves Computer Lack or not clear specs. Softwarei.e. Oracle System Specs. & type of goods Technology & Communication
Cause-and-Effect Diagram Prioritize list of Cs ANALYZE Type of Supplier Procedure / Policy Commitment of the supplier to delivery within the terms of PO Penalty Clauses Timely delivery of goods Lack of follow-up or monitoring Late submission of shipping docs Lack or not clear specs. Miscommunication Fax Machine Specs. & type of goods Technology & Communication
IMPROVE Proposed Solution Proposed Solutions • Short Term: • Strict Monitoring of supplier activities from receipt of PO to delivery of goods; • Call Supplier to confirm if they received the fax copy of PO • Call Supplier three days before the delivery deadline to remind them of their pending delivery for local and air shipment or as appropriate for sea shipment; and • To add in the notes to supplier of PO the following: “Please sign the lower right portion to acknowledge PO and fax it back to us. This will expedite payment after complete delivery” • B. Medium Term Solution: • Alert Supplier thru Oracle System every time PO is approved; • Alert Supplier thru Oracle System of their pending delivery prior to delivery deadline; • Development of Supplier Management System
IMPROVE Proposed Solution
Piloted Solution “To be process map” IMPROVE
IMPROVE FAILURE MODE and EFFECT ANALYSIS (FMEA)
Hypothesis Test IMPROVE Ho: mu1 = mu2 Null Hypothesis: There is no difference between the “as is” process and the “improved” process. Ha: mu1 is not = mu2 Alternative Hypothesis: There is a difference. Since P < 0.05 (0.000), we will reject Ho and accept Ha. Therefore, there is a difference between the “as is” and the “improved” sample data. Two-sample T for Days Orig. vs. Improved N Mean StDev SE Mean Days Orig. 247 11.1 22.7 1.4 Improved 93 2.43 4.78 0.50 Difference = mu (Days Orig.) - mu (Improved) Estimate for difference: 8.65491 95% CI for difference: (5.64415, 11.66568) T-Test of difference = 0 (vs. not =): T-Value = 5.66 P-Value = 0.000 DF = 296
Report for improved process IMPROVE
IMPROVE Report for improved process Previous Process Sigma is 1.38. Therefore an improvement of 1.28 was realized.
= current X = desired = direct influence = indirect influence = End-user * Control Stakeholder Analysis
Control Risk Assessment Matrix
Control Mistake Proofing & Control Sheet
Financial Benefits • SOFT SAVINGS • Avoidance of Capacity Enhancement • Increase Customer Satisfaction • Increase Employee Satisfaction
Financial Benefits Please see attached worksheet
Risk Analysis of Goods & Equipment
Thank you... The End!