Download
1 / 18
180 likes | 284 Vues
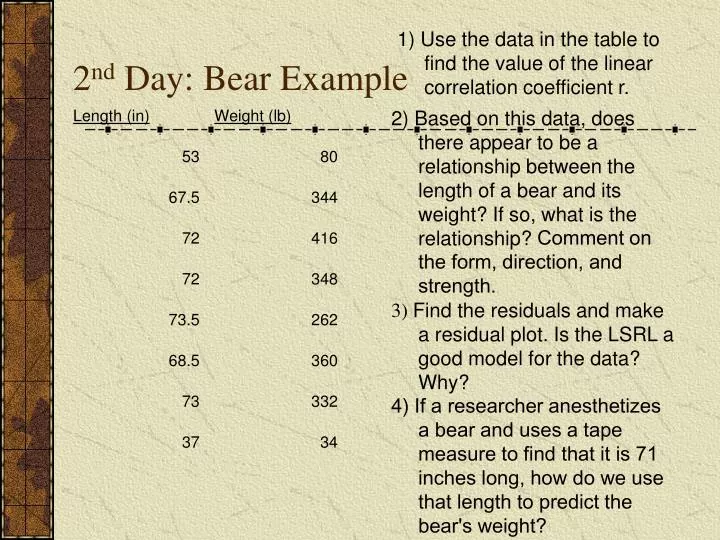
2 nd Day: Bear Example. Residual = observed y – predicted y. A residual plot plots the residuals on the vertical axis against the explanatory variable on the horizontal axis. The plot magnifies residuals and makes patterns easier to see. The mean of the residuals is always zero.

E N D
Residual = observed y – predicted y • A residual plot plots the residuals on the vertical axis against the explanatory variable on the horizontal axis. • The plot magnifies residuals and makes patterns easier to see. • The mean of the residuals is always zero
Residual Plot • Y = 0 helps orient us • TI83 Enter data from table, p. 234 Find vital stats Find residuals for data
Coefficient of Determination • Numerical quantity that tells us how well the LSRL predicts values of y. • R-sq: 2 components (SSM and SSE) • Shows us how much better the LSRL is at predicting y than if we just used y-bar as our prediction for every point. • If we have little info on predicting y (or if r is weak), we use as a predictor of y instead of y-hat.
Example • Data set: x 0 3 6 y 0 10 2 Association between x and y: positive, but weak • = 3, = 4 • Some use as a predictor of y, since r = .1890 (weak!) and we have little info on predicting y.
SSM • Measures the total variation of the y-values if we use y-bar to make predictions • Sum of Squares about the Mean = 4. The total area of these 3 squares is a measure of the total sample variability. • SSM = • X Y 0 0 16 3 10 36 6 2 4 = 56
Sum of Squares for Error (SSE) (Sum of the squares of the deviations of the points about LSRL) • If x is a good predictor of y, then the deviations and SSE will be small. • If all the points fall exactly on a regression line, SSE = 0. • LSRL: • Y-intercept = 3, passing through = (3, 4) (always the case) • SSE = X Y 0 0 9 3 10 36 6 2 9 = 54
Coefficient of Determination • The difference SSM-SSE measures the amount of variation of y that can be explained by the regression line of y on x. • The ratio of these two quantities is the proportion of the total sample variability that is explained by the least-squares regression of y on x. • For data set A, = (56-54)/56 = .0357 • That is, 3.57% of the variation in y is explained by least-squares regression of y on x • Check with Calculator
Points …. • If x is a poor predictor of y, then SSM and SSE are about the same • In ourex: if SSM = 56 and SSE = 54 Poor prediction line.
Understanding Regression • When you report a regression, is a measure of how successful the regression was in explaining the response (y). When you see a correlation, square it to get a better feel for the strength of the association. • Perfect correlation means = 1, so 100% of the variation in one variable is accounted for by the linear relationship with the other variable. • If r = -.7 or +.7, = .49 and about half the variation is accounted for by the linear relationship.
3.3: Correlation and Regression Wisdom(Residual Plot: Helps identify outliers)
Outlier vs. Influential point • Child 19 = outlier (but doesn’t affect regression line much due to other points with similar x-values nearby) • Child 18 = influential point, small residual (close to line but far out in x-direction, strong influence on regression line)
Misc. • Not all outliers are influential • The LSRL is most likely to be heavily influenced by observations that are outliers in the x direction. • Influential points often have small residuals since they pull the LSRL towards themselves. • Find the LSRL with and without the suspect point. If the line moves more than a small amount, the point is influential.
Strong positive linear association. The correlation is r = .9749. Since r-sq = .9504, the regression of of y on x will explain 95% of the variation in the values of y.
The AP Statistics exam was first administered in May 1997 to the largest first-year group in any discipline in the AP program. Since that time, the number of students taking the exam has grown at an impressive rate. Here are the actual data. Begin by entering them into your calculator lists. Year # students 1997 7,667 1998 15,486 1999 25,240 2000 34,118 2001 40,259 2002 49,824 2003 58,230 2004 65,878 2005 76,786 1. Use your calculator to construct a scatterplot of these data using 1997 as Year 1, 1998 as Year 2, etc. Describe what you see. 2. Find the equation of the least-squares line on your calculator. Record the equation below. Be sure to define any variables used. 3. Interpret the slope of the least-squares line in context. 4. How many students would you predict took the AP Statistics exam in 2006? Show your method. 5. Construct a residual plot. Sketch it in the space below. Comment on what the residual plot tells you about the quality of your linear model. 6. Interpret the value of from your calculator in the context of this problem.