Download
1 / 1
10 likes | 96 Vues
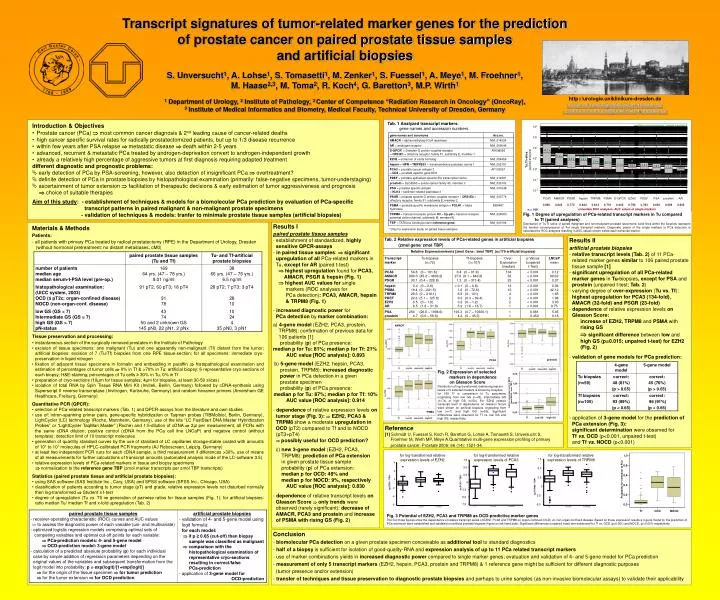
Transcript signatures of tumor-related marker genes for the prediction of prostate cancer on paired prostate tissue samples and artificial biopsies S. Unversucht 1 , A. Lohse 1 , S. Tomasetti 1 , M. Zenker 1 , S. Fuessel 1 , A. Meye 1 , M. Froehner 1 ,

E N D
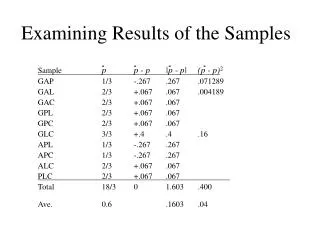
Transcript signatures of tumor-related marker genes for the prediction of prostate cancer on paired prostate tissue samples and artificial biopsies S. Unversucht1, A. Lohse1, S. Tomasetti1, M. Zenker1, S. Fuessel1, A. Meye1, M. Froehner1, M. Haase2,3, M. Toma2, R. Koch4, G. Baretton3, M.P. Wirth1 1 Department of Urology, 2Institute of Pathology, 3 Center of Competence “Radiation Research in Oncology” (OncoRay), 3Institute of Medical Informatics and Biometry, Medical Faculty, Technical University of Dresden, Germany http://urologie.uniklinikum-dresden.de susanne.fuessel@uniklinikum-dresden.de susanne.unversucht@uniklinikum-dresden.de Tab. 1Analyzed transcript markers: gene names and accession numbers Fig. 1 Degree of upregulation of PCa-related transcript markers in Tu compared to Tf (paired analyses) Distribution of Tu:Tf ratios of paired malignant and non-malignant prostate specimens: solid lines within the boxplots represent the median overexpression of the single transcript markers. Diagnostic power of the single markers in PCa detection is calculated by ROC analyses resulting in AUC values shown below each transcript marker. * Only for expression study on paired tissue samples lg (EZH2 / TBP) lg (PCA3 / TBP) AMACR prostein PCA3 PSMA Fig. 2 Expression of selected markers in dependence on Gleason Score Distribution of log-transformed relative expression levels of 5 selected markers is shown by boxplots for 169 Tf in comparison to Tu specimens originating from low GS (n=43), intermediate GS (n=74) or high GS (n=50). For EZH2 relative transcript level in dependence on Gleason Score were shown for artificial biopsies originating from low (n=7) and high GS (n=55). Significant differences were observed for Tf vs. low GS and high GS, respectively. lg (TRPM8 / TBP) for log-transformed relative expression levels of EZH2 for log-transformed relative expression levels of PCA3 for log-transformed relative expression levels of TRPM8 Fig. 3 Potential of EZH2, PCA3 and TRPM8 as OCD-predictive marker genes The first three figures show the dependence of relative transcript levels of EZH2, PCA3 and TRPM8 on organ-confined (OCD) vs. non-organ-confined disease. Based on these expression results a 3-gene model for the prediction of PCa extension were established and validated on artificial prostate biopsies (figure on left hand side). Significant differences (unpaired t-test) wer eobserved for Tf vs. OCD (p<0.001) and NOCD, (p<0.001) respectively. • Introduction & Objectives • Prostate cancer (PCa) most common cancer diagnosis & 2nd leading cause of cancer-related deaths • high cancer specific survival rates for radically prostatectomized patients, but up to 1/3 disease recurrence • within few years after PSA relapse metastatic disease death within 2-5 years • advanced, recurrent & metastatic PCa treated by androgen-deprivation convert to androgen-independent growth • already a relatively high percentage of aggressive tumors at first diagnosis requiring adapted treatment • different diagnostic and prognostic problems: • early detection of PCa by PSA-screening, however, also detection of insignificant PCa overtreatment? • definite detection of PCa in prostate biopsies by histopathological examination (primarily: false-negative specimens, tumor-understaging) • ascertainment of tumor extension facilitation of therapeutic decisions & early estimation of tumor aggressiveness and prognosis choice of suitable therapies Aim of this study: - establishment of techniques & models for a biomolecular PCa prediction by evaluation of PCa-specific transcript patterns in paired malignant & non-malignant prostate specimens - validation of techniques & models: tranfer to minimale prostate tissue samples (artificial biopsies) • Results I • paired prostate tissue samples • establishment of standardized, highly • sensitive QPCR-assays • in paired tissue samples: significant • upregulation of all PCa-related markers in • Tu, except for AR (paired t-test) • highest upregulation found for PCA3, • AMACR, PSGR & hepsin (Fig. 1) • highest AUC values for single • markers (ROC analyses for • PCa detection): PCA3, AMACR, hepsin • & TRPM8 (Fig. 1) • increased diagnostic power for • PCa detection by marker combination: • a) 4-gene model (EZH2, PCA3, prostein, • TRPM8): confirmation of previous data for • 106 patients [1] • probability (p) of PCa presence: • median p for Tu: 81%; median p for Tf: 21% • AUC value [ROC analysis]: 0.893 • b) 5-gene model (EZH2, hepsin, PCA3, • prostein, TRPM8): increased diagnostic • power in PCa detection in a given • prostate specimen • probability (p) of PCa presence: • median p for Tu: 87%; median p for Tf: 10% • AUC value [ROC analysis]: 0.914 • dependence of relative expression levels on • tumor stage (Fig. 3): EZH2, PCA3 & • TRPM8 show a moderate upregulation in • OCD (pT2) compared to Tf and to NOCD • (pT3+pT4) • possibly useful for OCD prediction? • c) new 3-gene model (EZH2, PCA3, • TRPM8): prediction of PCa extension • in given prostate tissue sample • probability (p) of PCa extension: • median p for OCD: 49% and • median p for NOCD: 9%, respectively • AUC value [ROC analysis]: 0.830 • dependence of relative transcript levels on • Gleason Score only trends were • observed (rarely significant): decrease of • AMACR, PCA3 and prostein and increase • of PSMA with rising GS (Fig. 2) • Materials & Methods • Patients: • all patients with primary PCa treated by radical prostatectomy (RPE) in the Department of Urology, Dresden • (without hormonal pretreatment; no distant metastases, cM0) • Tissue preservation and processing: • instantaneous section of the surgically removed prostates in the Institute of Pathology • excision of tissue specimens: one malignant (Tu) and one apparently non-malignant (Tf) distant from the tumor; artificial biopsies: excision of 7 (Tu/Tf) biopsies from one RPE tissue-section; for all specimens: immediate cryo-preservation in liquid nitrogen • fixation of adjacent tissue specimens in formalin and embedding in paraffin histopathological examination and estimation of percentages of tumor cells 0% in Tf & >70% in Tu; artificial biopsy: 6 representative cryo-sections of each biopsy; H&E-staining; percentages of Tu cells ≥ 30% in Tu, 0% in Tf • preparation of cryo-sections (10µm for tissue samples; 4µm for biopsies, at least 30-50 slices) • isolation of total RNA by Spin Tissue RNA Mini Kit (Invitek, Berlin, Germany)followed by cDNA-synthesis using Superscript II reverse transcriptase (Invitrogen, Karlsruhe, Germany) and random hexamer primers (Amersham GE Healthcare, Freiburg, Germany) • Quantitative PCR (QPCR): • selection of PCa-related transcript markers (Tab. 1) and QPCR-assays from the literature and own studies • use of: intron-spanning primer pairs, gene-specific hybridization or Taqman probes (TIBMolbiol, Berlin, Germany), LightCycler (LC) technology (Roche, Mannheim, Germany), use of the kits “LC FastStart DNA Master Hybridization Probes” or “LightCycler TaqMan Master” (Roche) and 1:5-dilution of cDNA 2µl per measurement, all PCRs with the same cDNA dilution; positive control (cDNA from the PCa cell line LNCaP) and negative control (without template); detection limit of 10 transcript molecules • generation of quantity standard curves by the use of standard of LC capillaries storage-stable coated with amounts of 101 to 107 molecules of HPLC-calibrated PCR fragments (AJ Roboscreen, Leipzig, Germany) • at least two independent PCR runs for each cDNA sample, a third measurement if differences >30%, use of means of all measurements for further calculations of transcript amounts (automated analysis mode of the LC-software 3.5) • relative expression levels of PCa-related markers in tissue and biopsy specimens • normalization to the reference gene TBP (zmol marker transcripts per zmol TBP transcripts) • Statistics (paired prostate tissue and artificial prostate biopsies): • using SAS software (SAS Institute Inc., Cary, USA) and SPSS software (SPSS Inc., Chicago, USA) • classification of patients according to tumor stage (pT) and grade; relative expression levels not disturbed normally then log-transformed Student`s t-test • degree of upregulation (Tu vs. Tf) generation of pairwise ratios for tissue samples (Fig. 1); for artificial biopsies: ratio median Tu/ median Tf and x-fold upregulation (Tab. 2) • Results II • artificial prostate biopsies • relative transcript levels (Tab. 2) of 11 PCa- • related marker genes similar to 106 paired prostate • tissue sample [1] • - significant upregulation of all PCa-related • marker genes in Tu-biopsies, except for PSA and • prostein (unpaired t-test; Tab. 2) • varying degree of over-expression (Tu vs. Tf): • highest upregulation for PCA3 (134-fold), • AMACR (32-fold) and PSGR (23-fold) • dependence of relative expression levels on • Gleason Score: • increase of EZH2, TRPM8 and PSMA with • rising GS • significant difference between low and • high GS (p=0.015; unpaired t-test) for EZH2 • (Fig. 2) • validation of gene models for PCa prediction: • application of 3-gene model for the prediction of • PCa extension (Fig. 3): • significant determination were observed for • Tf vs. OCD (p<0.001, unpaired t-test) • and Tf vs. NOCD (p<0.001) Tab. 2 Relative expression levels of PCa-related genes in artificial biopsies (zmol gene/ zmol TBP) Reference [1] Schmidt U, Fuessel S, Koch R, Baretton G, Lohse A, Tomasetti S, Unversucht S, Froehner M, Wirth MP, Meye A.Quantitative multi-gene expression profiling of primary prostate cancer. Prostate 2006; 66 (14): 1521-34. • Conclusion • biomolecular PCa detection on a given prostate specimen conceivable as additional tool to standard diagnostics • half of a biopsy is sufficient for isolation of good-quality-RNA and expression analysis of up to 11 PCa related transcript markers • use of marker combinations yields in increased diagnostic power compared to single marker genes; evaluation and validation of 4- and 5-gene model for PCa prediction • measurement of only 5 transcript markers (EZH2, hepsin, PCA3, prostein and TRPM8) & 1 reference gene might be sufficient for different diagnostic purposes • (tumor presence and/or extension) • - transfer of techniques and tissue preservation to diagnostic prostate biopsies and perhaps to urine samples (as non-invasive biomolecular assays) to validate their applicability