Download
1 / 15
150 likes | 154 Vues
This presentation explores the use of proxy modeling to assess the fiscal impact of major projects. It discusses the challenges faced by parliamentary budget offices and provides principles and modeling options for accurate cost estimation.

E N D
Proxy Modeling & Fiscal Impact of Major Projects Global Network of Parliamentary Budget Offices Community MeetingJune 10, 2014, Ottawa Ram Mathilakath, M.Com. (Banking), CIA Disclaimer: Any views or opinions included in this presentation are solely those of the author and do not necessarily represent those of the employer.
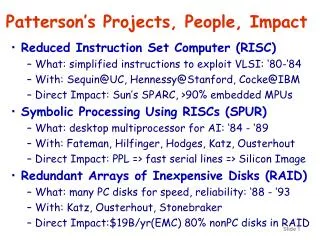
Need • Parliamentary committee debates are generally issue based – cost of a public policy, project or initiative. Decision support info requires: • Detailed bottom-up costs • Cradle to grave LCC vs. current FY appropriations – what parliament sees • Disaggregated information on horizontal issues by participating departments reported in a consistent manner • Timely costing info to support committee debates
Challenges • Parliamentary appropriations == Costs • Reporting to Parliament is not project specific • Data spread across departments • Coding • NPV of current & future obligations
Approach • Have an open mind & a healthy skepticism - In God we trust, everyone else brings data • Data mining & construction of waterfalls • Data patterns…? • Apply business valuation principles – multiples & benchmarks • Zero in on why costs are different when compared to benchmarks • E.g.: Asset deployment rate in Afghanistan
Approach • Using ranges • High:low estimates • Understanding relationship of costs & drivers in ‘theatre of war’ • Leverage power of collaboration & expert opinion • E.g. use of accelerated dep. on 4% & 8% of capital assets deployed in theatre of war – CBO discussion • Expert opinions to support development of a consensus cost estimate by benchmarking against the experiences of other countries.
Principles • Independent peer review panel to eliminate bias • collaboration with CBO, CRS, U of New Mexico, Queens, PSAB etc • Test of reasonableness
Modeling Options • Proxy modeling – use of surrogate in the absence of reliable data or methodology • minimizes data collection burden • High reliability when used with caution & minimizes data collection • Provides useful results in much less time • Stochastic modeling such as Monte-Carlo simulation helps estimate probability distributions of potential outcomes by allowing for random variation in one or more inputs over time. • Multiples & WACC – similar thought process • Top-down approach/statistical analysis such as trend and regression analysis to examine the correlation between cost drivers and costs.
Modeling Options • Deterministic approach is the simplest method used to look at best estimates. E.g.: Financial projections usually use the most likely rate with regard to: • default on loan • investment return • Foreign exchange rate etc. • The result provides a point estimate - the best single estimate of bank’s current solvency position or multiple points of estimate - depending on the problem definition. • Challenges: • Selection and identification of parameter values are difficult except for seasoned financial analysts. • Real world scenario is that a range of possible outcomes exists and some are more probable than others.
When to use • When PBO requires life cycle costs • Bottom –up data simply not available • Data cannot be trusted • Time is of the essence • Cannot directly measure what needs to be measured - an indirect measure provides sufficient insight
Examples of when Proxy Models could be used • Situation 1: Impact on depreciation costs from troop rotation, intensity of the tempo of war, usage rates, residual value of the asset deployed • e.g accelerated depreciation rate; range for caution • International bench mark – e.g. accelerated depreciation rates in the theatre of war; in the same area with similar tempo and intensity of war • Mimics thought process for business valuation of privately held companies • Situation 2: Government makes an IT investment based on a business case with a minimum ROI of 10% P.A. MC simulation allows for volatility of investment returns in each future time period or the chance that an extreme event (change in government, drastic changes to SLA, huge cost over runs etc) in a particular time period leads to an investment return less than the guarantee.
Public Policy QuestionIn-source, outsource, off-shore, P3? • New SSO has to show savings. • Unless mandated by Govt., revenues and expenditures could vary significantly. They depend on rate of compliance with SLAs, punitive payments for non-performance, inflation, % of cost over runs, savings during the period, and so on. • Savings calculation involves a set of projections, looking at what is expected to happen, and thus coming up with the best estimate for revenues and expenditures, and therefore for level of savings.
Examples • Impact of changes in charge backs on revenues, savings/profitability and demand • A serious question for government departments operating on cost-recovery basis
Final Thoughts • Bottom-up costing would be the best approach, but not always feasible • Cost proxies represents a possible approach, requires careful judgment • Use a combination of publicly available data, proxies when relevant, expert opinion and international bench marks • Power of collaboration! • Don’t get hung up on the academic holiness of models – focus on using models simply as a means
Notes • Examples of incremental costs attributable to the Afghanistan • Accelerated capital asset depreciation and increased reset costs • Fuel • O&M costs due to increased operational tempo in a theatre of war • Increased death and disability (veterans) benefits payout • Reservists pay; imminent danger pay and all incremental personnel costs related specifically to operations
Contact Ram Mathilakath, Executive Director, Finance,Canada Border Services Agency, Government of CanadaTele: +1 613 806 5757Ram.mathilakath@cbsa-asfc.gc.ca