Download
1 / 1

E N D
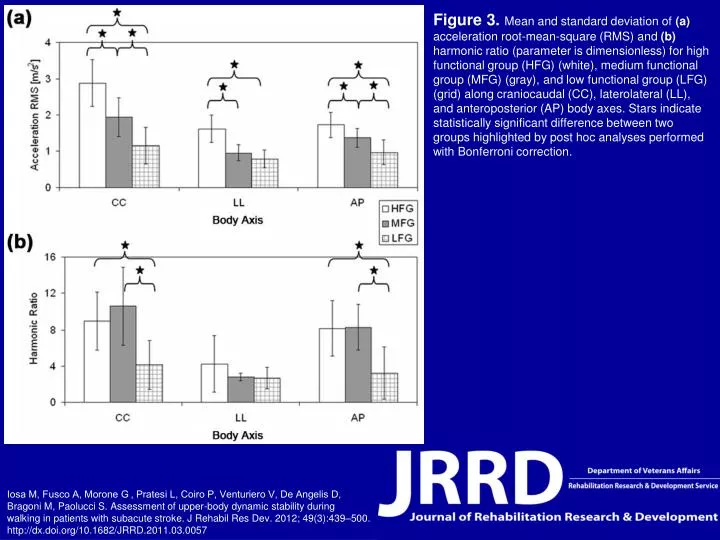
Figure 3. Mean and standard deviation of (a) acceleration root-mean-square (RMS) and (b) harmonic ratio (parameter is dimensionless) for high functional group (HFG) (white), medium functional group (MFG) (gray), and low functional group (LFG) (grid) along craniocaudal (CC), laterolateral (LL), and anteroposterior (AP) body axes. Stars indicate statistically significant difference between two groups highlighted by post hoc analyses performed with Bonferroni correction. Iosa M, Fusco A, Morone G , Pratesi L, Coiro P, Venturiero V, De Angelis D, Bragoni M, Paolucci S. Assessment of upper-body dynamic stability during walking in patients with subacute stroke. J Rehabil Res Dev. 2012; 49(3):439–500.http://dx.doi.org/10.1682/JRRD.2011.03.0057