Download
1 / 18
180 likes | 293 Vues
CLN QA/QC efforts. CCNY – (Barry Gross) UMBC- (Ray Hoff) Hampton U. (Pat McCormick) UPRM- (Hamed Parsiani). Outline. “Raw” signal tests. Matchups against Rayleigh Linearity tests with ND filters Member processing algorithms Efforts to test algorithms for consistency

E N D
CLN QA/QC efforts CCNY – (Barry Gross) UMBC- (Ray Hoff) Hampton U. (Pat McCormick) UPRM- (Hamed Parsiani)
Outline • “Raw” signal tests. • Matchups against Rayleigh • Linearity tests with ND filters • Member processing algorithms • Efforts to test algorithms for consistency • Indirect (Downstream) tests for retrieval accuracy • Potential QA/QC efforts for CLN
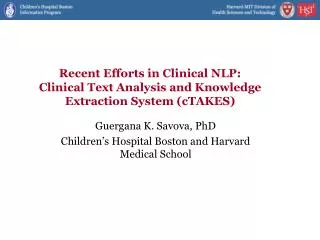
Testing multi-wavelength lidar signals to the molecular reference Representative matching of lidar profiles with Molecular profiles Lidar System Calibration Regression at 10-11 km
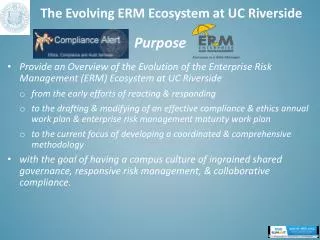
Lidar signal linearity: signal profiles and their ratios NDF-1 (OD=1.6) at 12:56 pm NDF-2 (OD=1.0) at 12:59 pm Lidar signal profiles Good linearity! Lidar signal ratio
CCNY Processing • Standard processing for 355 and 532 channels using Fernald Back-Integration method with S ratio pinned by AERONET AOD closure • Far end Scattering Ratio Condition (1.01 at 355nm, 1.06 at 532 nm) • Zmax determined by “minimum signal” method • 1064 channel uses system constant based on cirrus cloud calibration
CCNY Lidar Algorithm and Cross-Testing Efforts • Different algorithms tested against each other. • Intercompare iterative and Fernald solutions • Consistency check • Compare Measured Signal with Retrieved Signal after optical property retrieval • 1064 channel system constant evaluation over long time periods • Indirect assessment of standard Mie and Raman optical properties using thin Cloud Optical Depth retrievals. • Some preliminary cross-matchups with UPRM.
Validation (1)Fernald vs Iterative Blue=exact Fernald Green=iterative approximations N=5 N=20 N=10 N=2 Range
Validation (2)Consistency Check Comparison of theoretical and Measurement Signal 532nm 355 nm Errors < .3%
Raman COD retrieval based on successful derivation of cloud extinction and integrating Mie COD based on S. Young regression method and uses aerosol backscatter corrections above and below cloud Indirect Check of Optical Property retrieval using Cloud Optical Depth Clear sky for aerosol backscatter correction to COD
Cross-Testing of Retrieval Algorithmson same Data CCNY Processing UPRM Processing
Test of lidar signal linearity at 355-nm • Time and date: 1256PM--1259PM, April 21, 2006 • Method: • Insert the different Neutral density Filters (NDF) in front of • interference filter and PMT. • Background level is calculated from the average of • last 5-km lidar raw data. Mean and standard deviation are given. • Signal ratios are calculated with the different NDFs. • Their ratios should be the constant if both two signals are in the • linear ranges. • All data are the 2-min average lidar signal profiles. • please note: ignore the variability of atmosphere and laser power. • 3. For the NDF, higher optical density (OD) values correspond to the LOWER transmittances.