Download
1 / 25
260 likes | 402 Vues
Measuring Quality: Using Clinical Quality Indicators, Metrics and Dashboards to Measure Quality in Your Organisation. John Varlow, Director of Information Analysis Health and Social Care Information Centre . Environment and Context. System wide changes:

E N D
Measuring Quality: Using Clinical Quality Indicators, Metrics and Dashboards to Measure Quality in Your Organisation John Varlow, Director of Information Analysis Health and Social Care Information Centre
Environment and Context • System wide changes: • Anew system for commissioning, delivering, and accounting for health, public health and social care outcomes • New structures and responsibilities between NHS England, Public Health England, the Health and Social Care Information Centre (HSCIC), the Department of Health (DH) and Government • Attempt at genuine devolution to local organisations • New regulatory functionsfor statutory bodies
NHS OUTCOMES FRAMEWORK NHS OUTCOMES FRAMEWORK Domain 1 Domain 1 Domain 2 Domain 2 Domain 3 Domain 3 Domain 4 Domain 4 Domain 5 Domain 5 Preventing Preventing Enhancing Enhancing Recovery Recovery Ensuring a Ensuring a Safe Safe people from people from the quality the quality from from positive positive environment environment dying dying of life for of life for episodes of episodes of patient patient free from free from prematurely prematurely people with people with ill health / ill health / experience experience avoidable avoidable LTCs LTCs injury injury harm harm NICE Quality Standards NICE Quality Standards Duty of quality Duty of quality (Building a library of approx 150 over 5 years) (Building a library of approx 150 over 5 years) Duty of quality Duty of quality Provider payment mechanisms Provider payment mechanisms Clinical Commissioning Group Outcomes Indicator Set Commissioning Commissioning Commissioning Outcomes standard standard Guidance Guidance tariff tariff CQUIN CQUIN QOF QOF Framework contract contract Commissioning / Contracting Commissioning / Contracting NHS Commissioning Board NHS Commissioning Board – – certain specialist services and primary care certain specialist services and primary care GP Consortia GP Consortia – – all other services all other services Duty of quality Duty of quality The Quality Framework
Outcomes Frameworks • NHS Outcomes Framework (NHSOF) • Clinical Commissioning Group Outcome Indicator Set (CCGOIS) • Public Health Outcomes Framework (PHOF) • Adult Social Care Outcomes Framework (ASCOF)
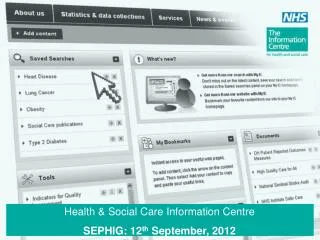
Indicators in Context: What Can We Say? The HSCIC’s website lists over 3,000 indicators, alongside other products, yet covers only a part of the full range of clinical care. There are many more indicators in use locally. This is illustrative of the challenges we face in monitoring clinical quality.
The Move to Monitoring Outcomes • Accountability shift from what is done, to what is achieved with available resources, demonstrating continuing improvement • In the absence of evidence based standards for some services, comparative data, for example stroke deaths, may show that outcomes are less than optimal • Evidence-based process indicators, for example those listed in NICE Quality Standards and the Outcomes Frameworks act as a proxy for outcomes • An intervention now may have an impact years / decades in the future; an outcome now may reflect interventions going back years / decades • Attribution and apportioning credit, hence accountability is likely to be difficult
What is a Metric? • A metric is a measure of a known attribute • eg a speedometer in a car dashboard • eg within clinical care, a blood pressure reading • Metrics, whether based on physical instruments or questionnaires, need rigorous testing and calibration plus precision in use
What is an Indicator? • An indicator describes how a measure is expected to be used to judge quality • includes clear statements about the intended goal / objective; • whether it is expected to be used in isolation or in combination with other measures or indicators; • any thresholds or standards which are expected to be applied • e.g. a gauge to show whether speed is within legal limits in a car dashboard • e.g. within clinical care, the proportion of patients with controlled high blood pressure • An indicator may act as an alert to an issue that needs further investigation
Indicator or Metric? • Metric – number of emergency readmissions to an acute hospital trust following an appendectomy • Indicator – rate of readmissions • Consider the context and may need to take into account • whether the readmissions are avoidable • co-morbidities • whether a certain number are acceptable • casemix of patients
Indicator Development • Is the indicator rationale supported by evidence? • Does the indicator relate to clinical care or outcome that is influenced by actions of commissioners or providers? • Has this aspect been identified as a priority? • Can the indicator be developed so that it is measurable? • Is there evidence of inappropriate variation in clinical care or outcomes? • Could adoption of best practice significantly improve quality and outcomes? • Is there scope for improvement?
Indicator Development • Do you want/need to look at a single aspect of care or whole pathway? • How will improvement be measured? • Who is your intended audience? • If you are comparing with other trusts are you comparing like with like? • Do you need a simple or composite indicator? • Provider or commissioner based? • Longitudinal or cross sectional? • Selection of number of indicators is not easy….
Clinical Quality Potential activities AVOIDING RISK RISK REDUCING RISK DISEASE / ILL HEALTH TIMELY INTERVENTION ADVERSE EVENTS LATE INTERVENTION QUALITY OF LIFE PREMATURE DEATH Deciding how many indicators to focus on • Single aspect eg renal dialysis versus whole pathway eg obesity, uncontrolled high blood pressure, kidney disease, QOL, deaths • Tension – too few may leave gaps and distort priorities, too many may overwhelm the organisation • Potential solution - hierarchies, with ability to drill down to detail, as necessary • Potential solution – menu, with ability to select those to be displayed in the dashboard
Information 5: Education and self-management Indicators: NICE Quality Standards
Establishing Limits and Thresholds • In any absence of evidence-based standards, it is important to establish a basis for judging quality and improvement • The ‘National Average’ is not always the best marker as it combines good and poor quality • It may be possible to arrive at some notion of ‘optimum’ based on best levels achieved elsewhere, for example cancer survival or emergency admissions in some parts of the country / other countries • Dependent on clarity around purpose of indicator and audience e.g. clinician, patient, policy maker, manager, public etc.
Indicator Assurance Process • Hosted on behalf of the whole system • Indicator Assurance Service • Standard indicator assurance templates • Methodology Review Group • Independent Peer Review • Indicator Assurance Process • Indicator Governance Board • National Library of Assured Indicators • Repository
Indicator Assurance Considerations • Purpose of indicator • Rationale, evidence based standard • What is measured – numerator, denominator, construction, source of data, completeness of counts, quality of data • How data are aggregated - type of analysis (direct/indirect standardisation), risk adjustment e.g. for age, gender, method of admission, diagnosis, procedure, co-morbidity etc. to compare ‘like’ with ‘like’ • Scientific validity – face, content, construct, criterion, predictive; validity for public, clinicians, performance • Interpretation – identifying outliers, explaining observations • Use – timeliness, gaming, costs, access, credibility, feasibility, usefulness • Investigation and action – play of chance, artefacts (e.g. data quality), quality of care
Indicator Development and Assurance • Skills and expertise from HSCIC and the wider system • Methodologists • Epidemiologists • Statisticians • Subject Matter Experts • Informatics Specialists • Measurement Specialists • Clinicians and Patients
Dashboards • “All that glitters is not gold” Shakespeare – Merchant of Venice • “Simplify, simplify, simplify!” Henry David Thoreau • “Maximise the data – ink ratio” Edward R Tufte – The Visual Display of Quantitative Information • “Unless you know what you’re doing you’ll end up with a cluttered mess” Stephen Few – Information Dashboard Design: The Effective Visual Communication of Data
Dashboards: 13 Common Mistakes • Exceeding a single screen • Supplying inadequate context • Displaying excessive detail or precision • Choosing deficient measures • Choosing inappropriate visualisation • Introducing meaningless variety • Using poor design • Encoding quantitative data inaccurately • Arranging the data poorly • Highlighting important data ineffectively • Cluttering with useless decoration • Misusing colour • Unattractive display
In Conclusion • There are a lot of indicators out there • Ultimate choice depends on whether they meet criteria for good indicators • National indicators for NHSOF and CCGOIS – assured and tested • Local indicator development based on local priorities • Consider triggers and alerts • Uses for Board reporting and assurance • Dashboards can be used to support delivery of safe and effective care – but only if they are well designed • Integrating local data flows – instantaneous reporting