Download
1 / 34
340 likes | 351 Vues
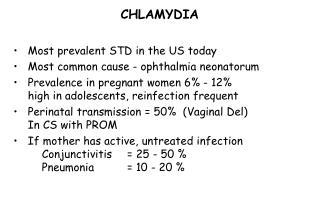
Chlamydia. California STD Surveillance 2017. Chlamydia, California versus United States Incidence Rates, 1990 – 2017. Rev. 9/2018. Chlamydia, Incidence Rates by County, California, 2017. Rev. 7/2018. Chlamydia, Cases by County, California, 2017. Rev. 7/2018.

E N D
Chlamydia California STD Surveillance 2017
Chlamydia, California versus United StatesIncidence Rates, 1990–2017 Rev. 9/2018
Chlamydia, Incidence Rates by County, California, 2017 Rev. 7/2018
Chlamydia, Cases by County, California, 2017 Rev. 7/2018
Ranking of County Chlamydia RatesCalifornia, 2017(with 95% Confidence Intervals*) * Confidence intervals were calculated using Poisson exact method; excludes counties with no cases or statistically unstable rates. Note: Rates are per 100,000 population. Source: California Department of Public Health, STD Control Branch Rev. 7/2018
Chlamydia among Females Ages 15-24Incidence Rates by County, California, 2017 Rev. 7/2018
Chlamydia among Youth Ages 15-19Incidence Rates by County, California, 2017 * No cases reported or statistically unstable rates. Rev. 7/2018
Chlamydia among Females Ages 15-19Incidence Rates by County, California, 2017 * No cases reported or statistically unstable rates. Rev. 7/2018
Chlamydia among Males Ages 15-19Incidence Rates by County, California, 2017 * No cases reported or statistically unstable rates. Rev. 7/2018
Chlamydia, Incidence Rates by Region California, 2008–2017 Rev. 7/2018
Number of Chlamydia Cases by Region, Gender, and YearCalifornia, 2008–2017 Rev. 7/2018
Chlamydia, Incidence Rates by GenderCalifornia, 1990–2017 Rev. 7/2018
Chlamydia, Incidence Rates by GenderCalifornia, 1990–2017. Rev. 7/2018
Chlamydia, Incidence Rates by Gender and Age Group (in years) , California, 2017 Note: Age was “Not Specified” for 0.2% of female cases and 0.2% of male cases for the given year. Since this disease is often asymptomatic, reported cases may reflect chlamydial infections identified through screening programs offered primarily to women. Rev. 7/2018
Chlamydia, Incidence Rates by Gender and Age Group (in years), California, 2017 Note: Age was “Not Specified” for 0.2% of female cases and 0.2% of male cases for the given year. Since this disease is often asymptomatic, reported cases may reflect chlamydial infections identified through screening programs offered primarily to women. Rev. 7/2018
Chlamydia, Incidence Rates for Females by Age Group (in years), California, 2008–2017 Note: Age “Not Specified” ranged from 0.2% to 0.4% of cases for females in any given year. Rev. 7/2018
Chlamydia, Incidence Rates for Males by Age Group (in years), California, 2008–2017 Note: Age “Not Specified” ranged from 0.2% to 0.5% of cases for males in any given year. Rev. 7/2018
Chlamydia, Incidence Rates for Adolescent/Young Adult Females by Age Group (in years), California, 2008–2017 Note: Age “Not Specified” ranged from 0.2% to 0.4% of cases for females in any given year. Rev. 7/2018
Chlamydia, Incidence Rates by Gender and Race/Ethnicity, California, 2017 Note: Race/Ethnicity was “Not Specified” for 35.7% of female cases and 31.5% of male cases for the given year. Since this disease is often asymptomatic, reported cases may reflect chlamydial infections identified through screening programs offered primarily to women. Rev. 7/2018
Chlamydia, Female Incidence Rates by Race/Ethnicity and Age Group (in years), California, 2017 Note: A/PI = Asian/Pacific Islander Native American/Alaskan Native and race-specific data for ages 0-14 are suppressed as per agency Data De-Identification Guidelines (DDG). The age-specific Native American/Alaskan Native rates were slightly higher than those for Hispanic. Rev. 7/2018
Chlamydia, Male Incidence Rates by Race/Ethnicity and Age Group (in years), California, 2017 Note: A/PI = Asian/Pacific Islander Native American/Alaskan Native and race-specific data for ages 0-14 are suppressed as per agency Data De-Identification Guidelines (DDG). The age-specific Native American/Alaskan Native rates were slightly higher than those for Hispanic. Rev. 7/2018
Chlamydia, Incidence Rates for Females by Race/Ethnicity, California, 2008–2017 Note: NA/AN = Native American/Alaskan Native, A/PI = Asian/Pacific Islander. Race/ethnicity “Not Specified” ranged from 33.0% to 42.0% of cases for females in any given year. Rev. 7/2018
Chlamydia, Incidence Rates for Males by Race/Ethnicity, California, 2008–2017 Note: NA/AN = Native American/Alaskan Native, A/PI = Asian/Pacific Islander. Race/ethnicity “Not Specified” ranged from 31.5% to 38.9% of cases for males in any given year. Rev. 7/2018
Chlamydia, Incidence Rates for Females Ages 15-19 by Race/Ethnicity, California, 2008–2017 Note: A/PI = Asian/Pacific Islander. Race/ethnicity “Not Specified” ranged from 29.8% to 38.7% of cases for females ages 15-19 in any given year. Native American/Alaskan Native data for ages 15-19 are suppressed as per agency Data De-Identification Guidelines (DDG). Rev. 7/2018
Chlamydia, Incidence Rates for Males Ages 15-19 by Race/Ethnicity, California, 2008–2017 Note: A/PI = Asian/Pacific Islander. Race/ethnicity “Not Specified” ranged from 30.4% to 39.6% of cases for males ages 15-19 in any given year. Native American/Alaskan Native data for ages 15-19 are suppressed as per agency Data De-Identification Guidelines (DDG). Rev. 7/2018
Chlamydia Prevalence Monitoring, Percent Positive for Females of Selected Age Groups, by Health Care Setting, California, 2017 * This venue targets adolescents primarily. Source: California Department of Public Health, STD Control Branch Rev. 9/2018
Chlamydia Prevalence Monitoring, Percent Positive for Females at Family Planning Title X Clinics, by Age Group (in years), California, 2008–2017 * The 2010-2017 prevalence may not be consistent with prior years’ data due to the impact of major changes in the data transmission process (including a much larger number of sites). † Test volume for 10-14 year old females tends to be significantly less than that for older age groups; thus prevalence estimates and trends may be unstable. Source: California Department of Public Health, STD Control Branch Rev. 9/2018
Chlamydia Prevalence Monitoring, Percent Positive for Females at Family Planning Quest Clinics, by Age Group (in years), California, 2017 Source: California Department of Public Health, STD Control Branch Rev. 9/2018
Chlamydia Prevalence Monitoring, Percent Positive at STD Clinics, by Gender and Age Group (in years), California, 2017 * Male data may disproportionately reflect symptomatic or exposure-based testing, and likely overstates prevalence. † Test volume for 10-14 year olds tends to be significantly less than that for older age groups; thus prevalence estimates would be unstable and are not shown. Source: California Department of Public Health, STD Control Branch Rev. 9/2018
Chlamydia Prevalence Monitoring, Ranking of Percent Positive for Females at Selected Juvenile Detention Facilities, California, 2017 Source: California Department of Public Health, STD Control Branch Rev. 9/2018
Chlamydia Prevalence Monitoring, Percent Positive for Females in a Northern California Managed Care Organization, by Age Group (in years), 2017 Source: California Department of Public Health, STD Control Branch Rev. 9/2018
Chlamydia and Gonorrhea Repeat Infection among Females 1-6 months after Infection*by Data Source, California, 2017 * Percent of first repeat case report or positive test result within 1-6 months. Case report and family planning data include all initial infections that occurred in 2017, with repeat infections captured through the first half of 2018. Managed care data were limited to initial infections and repeat infections within 2017. † Excludes Los Angeles , and San Francisco. Rev. 9/2018
Estimated Chlamydia Screening Coverage (HEDIS), Females Age 15–24, USA and California, 1999–2015 Source: National Committee on Quality Assurance; California DHCS Division of Medi-Cal Managed Care (2015 data not available); Kaiser Permanente Northern CA; California DHCS Office of Family Planning Rev. 7/2017
Percent of Chlamydia Tests by Test TypeCalifornia Annual Lab Survey, 1996–2012 † NAATs: Nucleic acid amplification tests Rev. 7/2015