Download
1 / 12
120 likes | 194 Vues
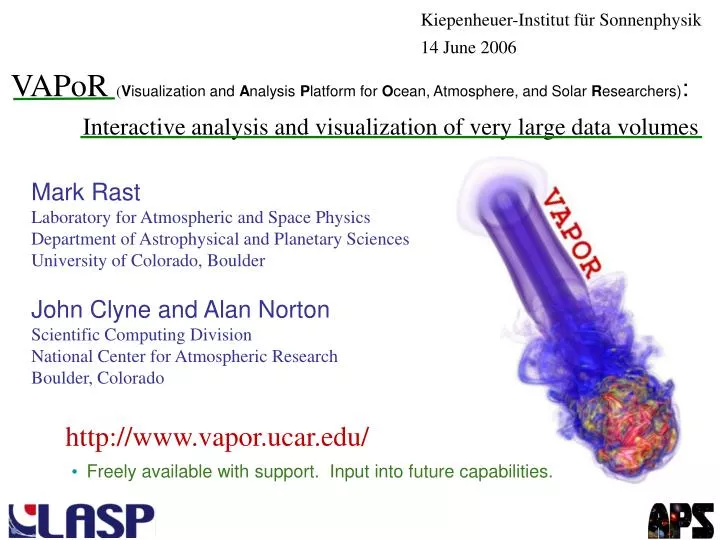
Kiepenheuer-Institut für Sonnenphysik 14 June 2006. VAPoR ( V isualization and A nalysis P latform for O cean, Atmosphere, and Solar R esearchers) : Interactive analysis and visualization of very large data volumes. Mark Rast Laboratory for Atmospheric and Space Physics

E N D
Kiepenheuer-Institut für Sonnenphysik 14 June 2006 VAPoR (Visualization and Analysis Platform for Ocean, Atmosphere, and Solar Researchers): Interactive analysis and visualization of very large data volumes Mark Rast Laboratory for Atmospheric and Space Physics Department of Astrophysical and Planetary Sciences University of Colorado, Boulder John Clyne and Alan Norton Scientific Computing Division National Center for Atmospheric Research Boulder, Colorado http://www.vapor.ucar.edu/ • Freely available with support. Input into future capabilities.
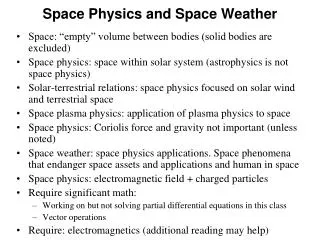
Numerical models which can currently be run on typical supercomputing platforms produce data in amounts that make storage expensive, movement cumbersome, visualization difficult, and detailed analysis impossible. The result is a significantly reduced scientific return from the largest computational efforts. We can now compute more data than we can analyze. • Not all technologies advance at the same rate • Multiprocessor simulation vs. single/dual processor analysis Most analysis tools have poor volume visualization capabilities and most visualization tools have only rudimentary analysis capabilities.
Example: Compressible plume dynamics • 504x504x2048 • 5 variables (u,v,w,rho,temp) • ~500 time steps saved • 9TBs storage (4GBs/variable/timestep) • Six months compute time required on 112 IBM SP RS/6000 processors
What is meant by interactive analysis? Definition: A system is interactive if the time between a user event and the response to that event is short enough maintain my full attention If the response time is… 1-5 seconds : I’m engaged 5-60 seconds : I’m tapping my foot 1-3 minutes : I’m reading email > 3 minutes : I’ve forgotten why I asked the question! IO wait times for high resolution simulations: • Assumptions • Single precision • 100 MB/sec bandwidth • No contention Develop a tool with which one can interactively analyze and visualize very large data volumes.
Rendering timings Interactive 5123 Compressible Convection 5042x2048 Compressible Plume SGI Octane2, 1x600MHz R14k SGI Origin, 10x600MHz R14k Reduced resolution affords responsive interaction while preserving all but finest features.
Calculation timings SGI Origin, 10x600MHz R14k Note: 1/2th resolution is 1/8th problem size, etc Interactive 5123 Compressible Convection Deriving new quantities on interactive time scales only possible with data reduction
Key VAPoR components: • Multiresolution data access and subregion sampling • Enable speed/quality tradeoffs • Tightly coupled to existing analysis tools • IDL, MatLab • Advanced volume visualization tool • Histogram based transfer funtion editor, Field line tracing, etc. An interactive multiresolution visualization and analysis tool.
Haar operators Wavelet Transforms for 3D Multiresolution data representation: • Hierarchical data representation • Invertible and lossless (subject • to floating point round off errors) • Numerically efficient • No additional storage cost Example: Haar Wavelet (current VAPoR format) Store averages and differences.
Compressible Convection Rast, 2002 1283 5123
Compressible plume Compressible plume data set shown at native and progressively coarser resolutions Rast, 2002 Resolution: Problem size: 504x504x2048 Full 252x252x1024 1/8 126x126x512 1/64 63x63x256 1/512
A test of multiresolution analysis: Force balance in supersonic downflows Resolution Full Half Subdomain selection and reduced resolution together yield data reduction by a factor of 128! Sites of supersonic downflow are also those of very high vertical vorticity. The cores of the vortex tubes are evacuated, with centripetal acceleration balancing that due to the inward directed pressure gradient. Buoyancy forces are maximum on the tube periphery due to mass flux convergence. The same interpretation results from analysis at half resolution.
Future Plans: • Incorporate visualization techniques based on scientists’ needs • Nonuniform grids • Adaptive grids • Understand effect of data compression • Error analysis and error visualization • Obtain bounds on degradation of analysis results • Explore lossy data compression • Improve access to terabyte datasets • Multiresolution data output as a byproduct of the simulation