Download
1 / 26
280 likes | 690 Vues
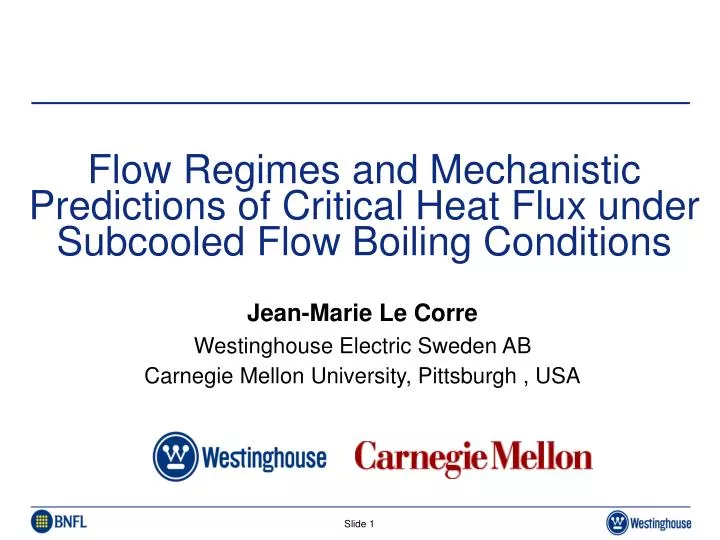
Flow Regimes and Mechanistic Predictions of Critical Heat Flux under Subcooled Flow Boiling Conditions . Jean-Marie Le Corre Westinghouse Electric Sweden AB Carnegie Mellon University, Pittsburgh , USA. Outline. Introduction Visual experiments, Flow regime types and Flow regime map at DNB

E N D
Flow Regimes and Mechanistic Predictions of Critical Heat Flux under Subcooled Flow Boiling Conditions Jean-Marie Le Corre Westinghouse Electric Sweden AB Carnegie Mellon University, Pittsburgh , USA
Outline • Introduction • Visual experiments, Flow regime types and Flow regime map at DNB • Postulated mechanistic modeling at DNB • Selected DNB model(s) • Model validation and applications (1D and 3D) • Conclusions and on-going work
Introduction • Boiling crisis is an important limiting parameter in boiling system • DNB = boiling crisis under subcooled boiling conditions • Physical modeling of DNB is not well established • Mechanistic DNB prediction is useful in development of new fuel design • Both 1D and 3D applications are desirable
DNB visual experiments & flow regime map • Review of visual experiments available in the literature • Various flow regimes were reported • Dimensional analysis reveals relevant parameters • Consistent calculation of relevant local parameters • Preliminary map of flow two-phase flow regimes at DNB is established: • Low pressure • Limited geometric range • X and We as relevant parameters • More systematic experimental work is needed
DNB visual experiments & flow regime map Three main types of flow regime at DNB: Type 1: Bubbly flow Type 2: Near-wall vapor clots Type 3: Slug flow
DNB flow regime map Type 1 Type 2 Type 3
Postulated mechanistic modeling at DNB • Various DNB physical modeling can be found in literature • Most used models relied on near-wall two-phase flow hydrodynamics only • Experimental evidence show that • Various flow pattern can exist at DNB (from “non-packed” bubbly flow to slug flow) • No near-wall macroscopic change at DNB • Wall effect (e.g. thickness) is important • Goal: Select model in agreement with experimental observations
DNB modeling in the literature • Theoretical studies: • Near-wall bubble crowding model (Weisman and Pei, 1983) • Liquid sublayer dryout model (Lee and Mudawar, 1988) • Many others… • Experimental studies: • Three main types of flow regime at DNB • Dry patch formation + quenching prevention has been mentioned for Type 1 and 3 (few theoretical studies) • Bubbly layer lift-off model (Mudawar) hypothesized for Type 2
Selected DNB model • Basic DNB modeling is based on a dry spot created under a nucleating bubble (1) or a vapor clots (2) or a vapor slug (3) • Temperature locally increases under dry area then decreases due to quenching • Quenching may be prevented in the limiting case (Leidenfrost) • Resulting dry patch may spread through radial conduction
DNB physical modeling (Type 1) • 2D transient wall thermal response to nucleation cycle is calculated (ADI scheme + transient heat flux boundary conditions) • Model consistent with wall boiling model is desirable • Most needed parameters are in use in wall partitioning model (e.g. RPI model)
DNB physical modeling (Type 1) • A limiting nucleation site is considered (stochastic nature) • Domain extend to as many “averaged” nucleation sites as necessary
DNB physical modeling (Type 1) • Needed (optional) constitutive relations: • Bubble departure diameter (& bubble growth rate) • Time of evaporation • Bubble departure frequency • Nucleation site density • Evaporation heat flux (transient form) • Quenching heat flux (transient form) • Limiting conditions
Model validation and applications • Model validation • Limiting nucleation site is the key to the model • Use detailed boiling data at DNB (bypass most constitutive relations) to show Leidenfrost effect can happen • Model various CHF points (1D) to study the limiting nucleation site • Model applications • 1D • 3D
Model validation (Del Valle & Kenning data) • Detailed boiling information were reported form 70-95% of DNB (bubble departure diameter, bubble departure frequency, nucleation site density,…) • Parameters from most limiting nucleation site calculated from statistical distribution • Used for DNB model validations (Type 1) • Wall superheat around 100 C can be reached allowing for Leidenfrost effect (150 ± 50 C)
Model validation (Del Valle data) • 2D transient wall thermal response to Nucleation cycle • DNB occurrence • Wall thermal response immediately after DNB (dry patch spreading)
Model validation (Del Valle data) • 2D transient wall thermal response to Nucleation cycle • DNB occurrence • Wall thermal response immediately after DNB (dry patch spreading) L 1 2 3
Model validation (Del Valle data) Hot spot superheat Dry patch radius Time
Model applications (on going) • 1D applications: in progress… • Look-up CHF database • Study of limiting nucleation site • 3D applications: • Limited by current advances in the field • Prototype CFX-5.7.1 was used in simple geometry • Validated at high pressure • Validation at low pressure performed in this work • Applied to CFD experiments at high pressure (DeBortoli, 1958) • Approach to complex geometry and fuel assembly design
3-D CFX-5.7.1 validation (Bartel data) Volumetric interfacial area Void fraction
3-D DNB Model Applications (on-going) • DeBortoli data (1958) • Local We = 2426 at DNB, local x = -0.086 • Type 2 region but probably Type 1 at high pressure • Modified Unal’s model was used • Limiting nucleation site = 2* “averaged” bubble diameter • DNB model application: • Peak wall superheat = 105 C for 0.5 mm SS heater • Peak wall superheat = 95 C for 1.0 mm SS heater
3-D application in complex geometries • Not in the scope of the current research program • No accurate prediction of CHF is expected • Correct parametric trends and correct treatment of 3D effects are expected • Approach: • Compute peak wall superheat in each near-wall computational cell (CFD post-processing) • Show local weak spot relative to DNB • Design goal is a low (& uniform) peak wall superheat
Conclusions • Different model of DNB can apply (compete) depending on conditions (pressure, We, x) • A “most likely” mechanism is identified for Type 1 (and Type 3) • Model is validated using detailed boiling data • Definition of limiting nucleation site is the key • Additional validations, 1D and 3D applications are on going • Accurate prediction of CHF is not expected • Help in increasing CHF performance of complex systems